|
|
|
|
|
|
|
|
Tuesday's are usually bland days. It's not Monday where we can digest the weekend news, it's not Wednesday as we feel we are half way through the week. Thursday's are good knowing we have the weekend in our sights. Friday's are good because once we get past the big economic news we start thinking shutting down early. This Tuesday we have Fed Chairman Powell speaking in front of Congress. He's doing a decent job as usual with nothing new or market moving.
The major
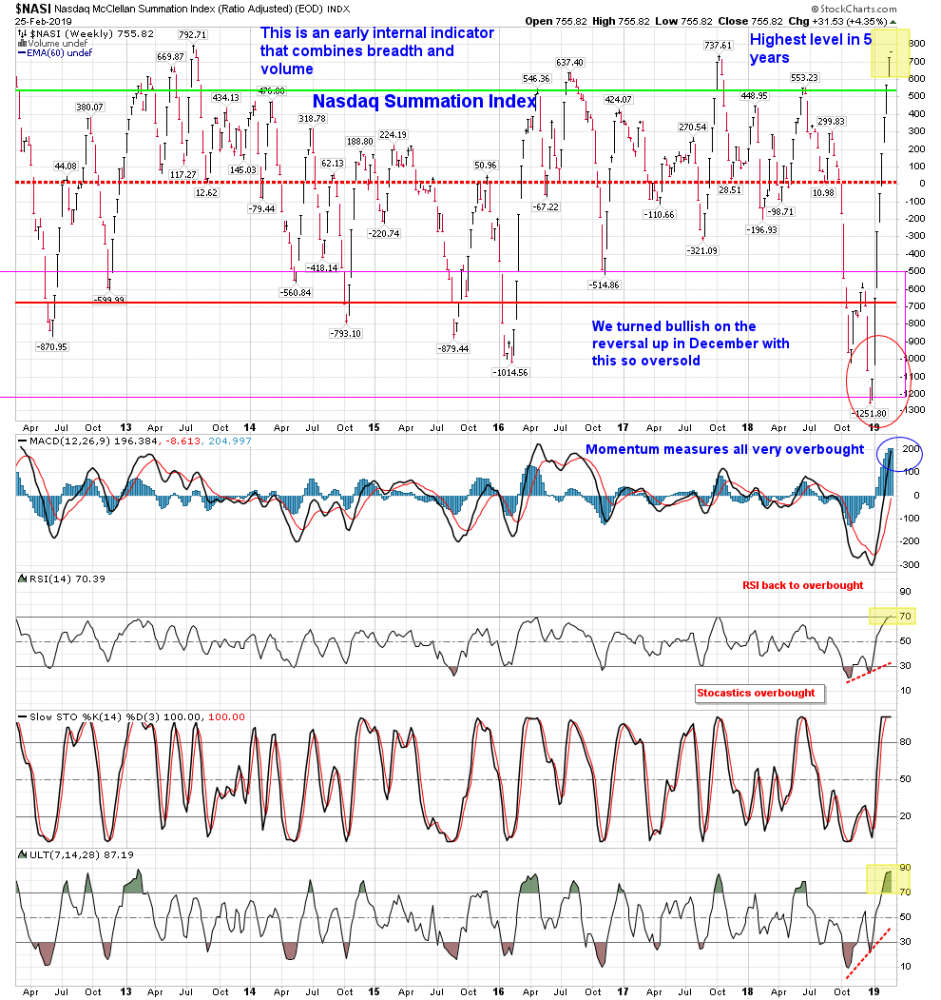
indexes in the US are tired and bounced back to flat from overnight lows. Sentiment remains elevated but off the recent highs. One of the internal indicators I show often, the Nasdaq Summation Index is now at a 5 year high after making a 10 year low in December. The percentage of stocks above the 10, 50, and 200 day moving average on most indexes shows the 10 and 50 day at extreme high levels while the 200 day is back to the levels seen before the market pullback in Q4. Look out for divergences to start to develop in the coming days and weeks.
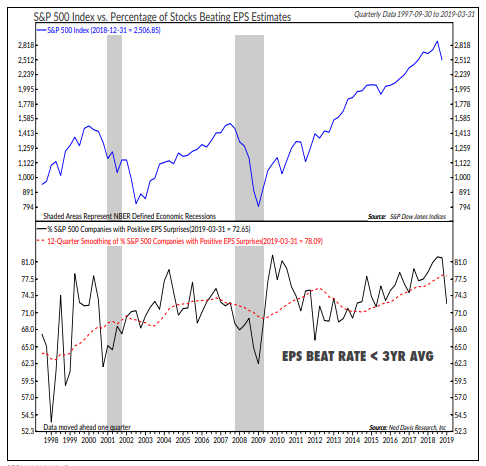
Factset put out a note showing the S&P will have a year over year decline in earnings growth and a year over year margin decline for the first time since 2016. Ned Davis Research put out a note saying the 3 year average beat rate is running below average and that it's a positive... if we stay out of a recession. They said it reflected pessimism in the market. I find this statement a little odd because
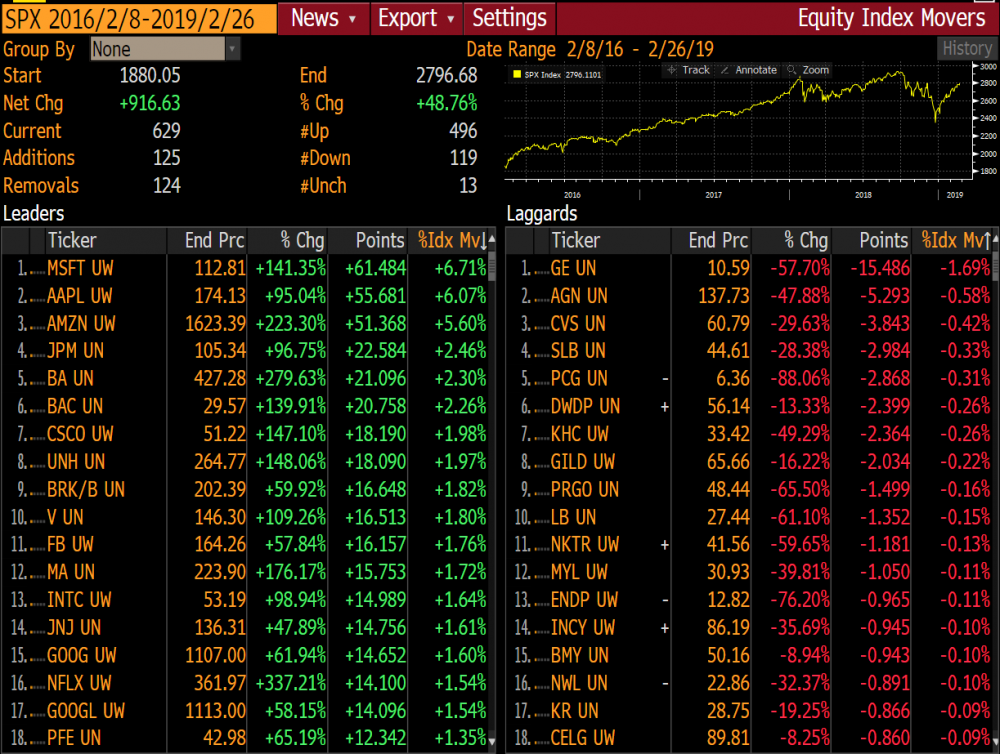
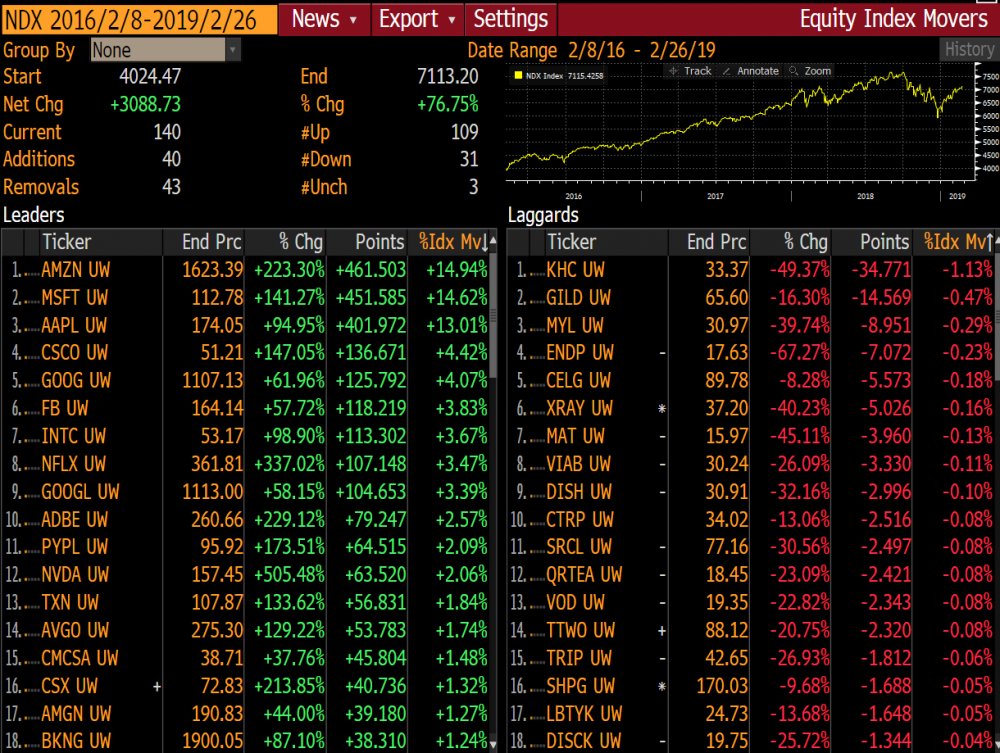
companies miss earnings because analysts are too positive. Lastly I ran the S&P and NDX attribution studies from the lows from February 2016 the last significant bottom (besides last December). My concern is that the major gains in both indexes came from the top 10 or even 5 stocks and those mega caps have been stocks that have generated the most in earnings growth too. I expect several of the mega caps to not hit new highs this year.
All of this says it's time to be cautious after this recent run. Raise some cash, raise stops, hedge with some puts or put spreads or short if you can.
|
|
|
|
|
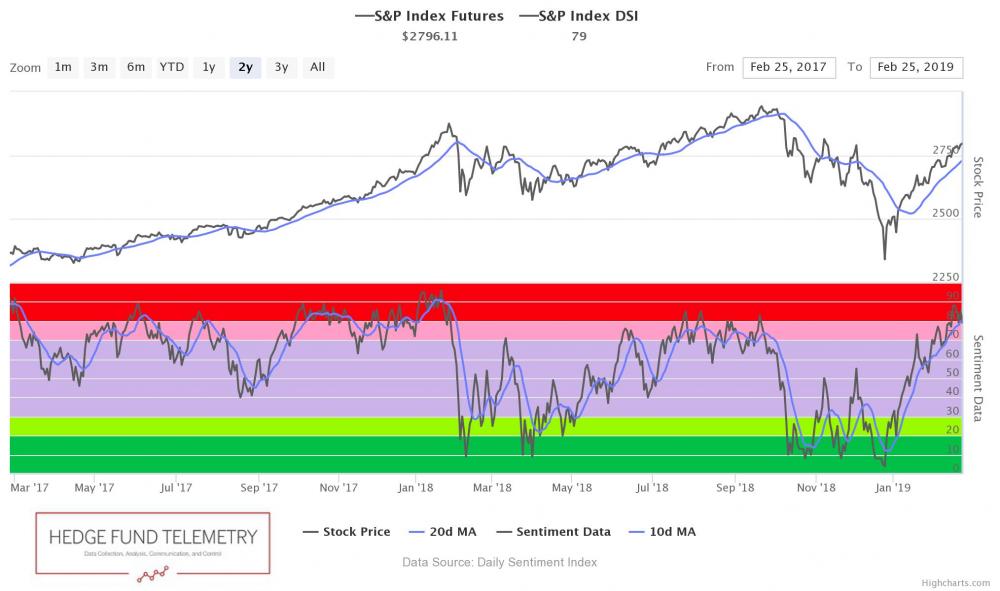
SPX bullish sentiment is at 79%
|
|
|
|
|
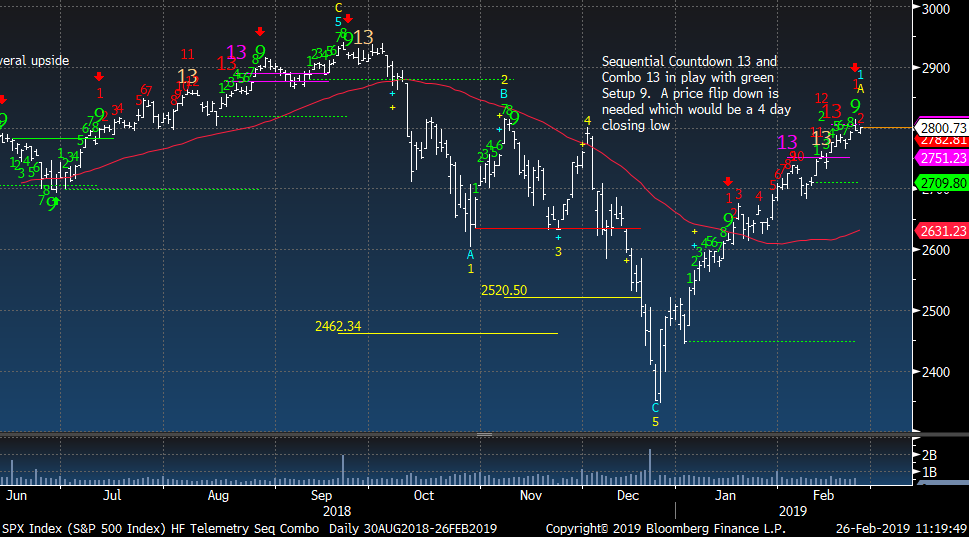
SPX daily should turn lower in the next few days
|
|
|
|
|
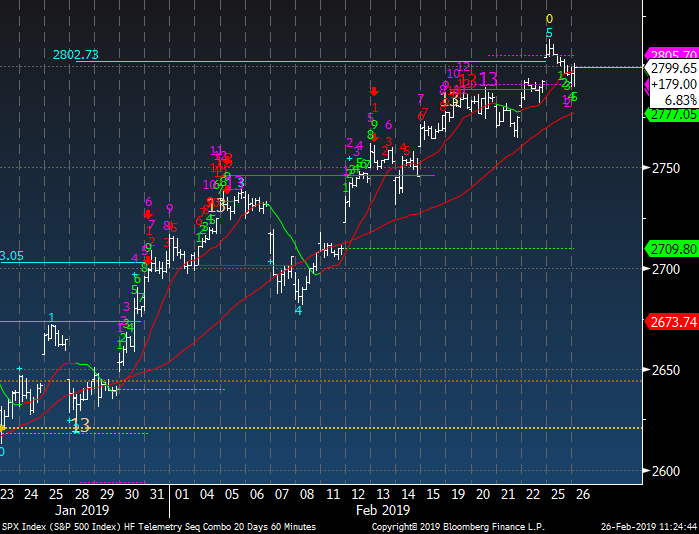
SPX 60 minute tactical time frame hit the upside wave 5 price objective yesterday
|
|
|
|
|
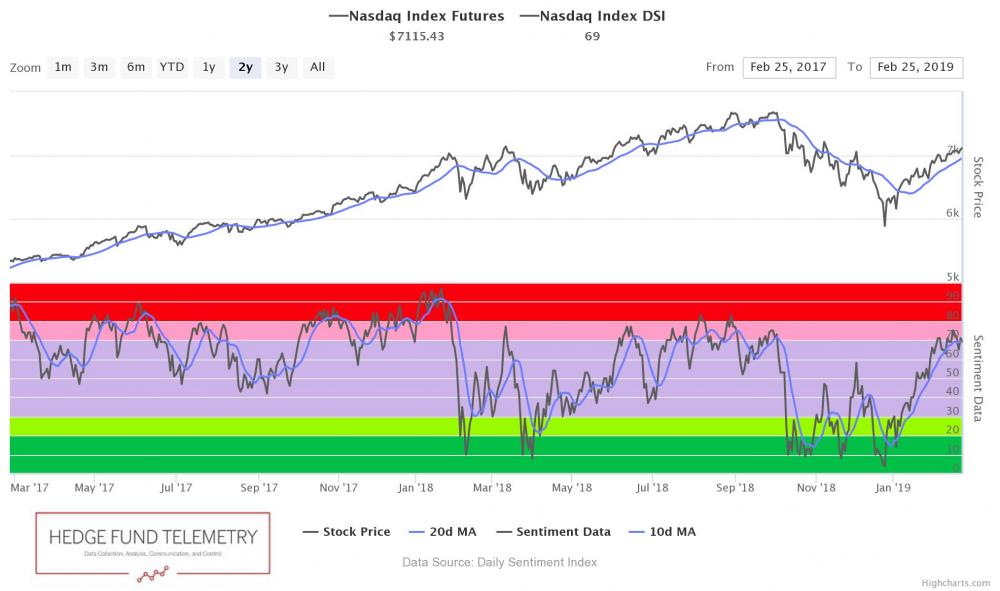
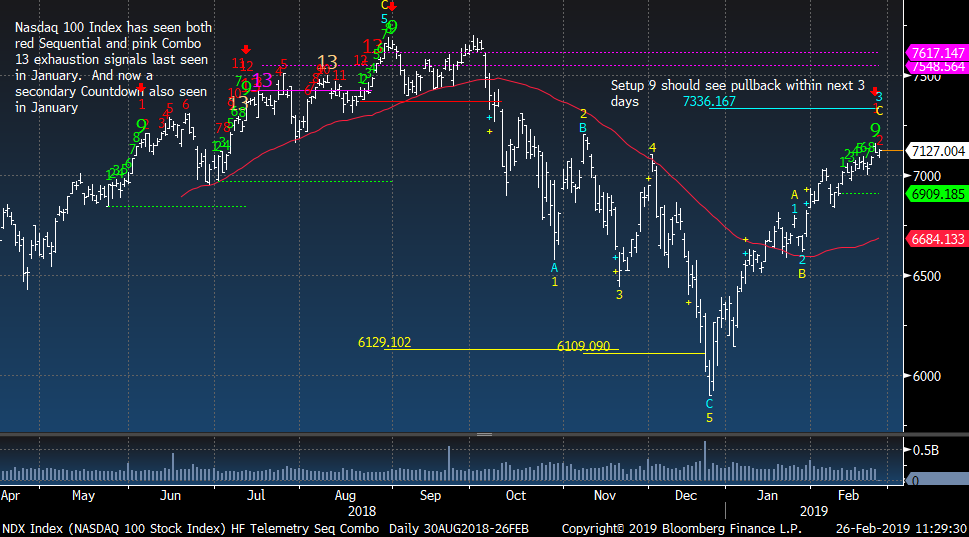
Nasdaq bullish sentiment is at 69%
|
|
|
|
|
NDX Index should turn lower in next few days
|
|
|
|
|
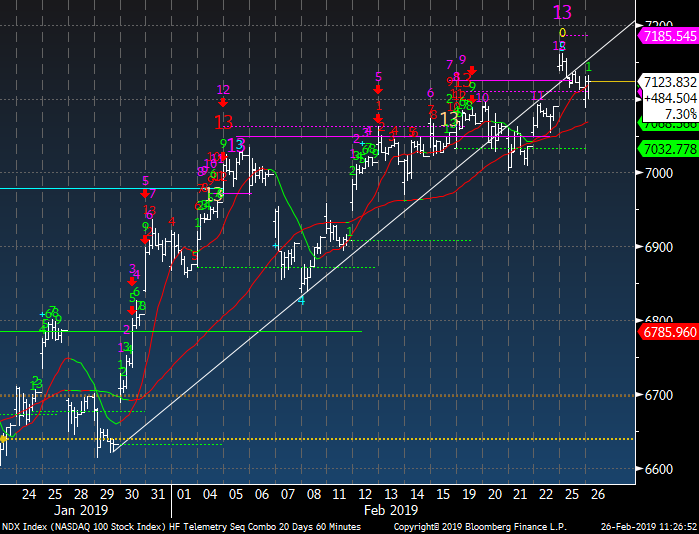
NDX 60 minute tactical time frame watching this trend line
|
|
|
|
|
Nasdaq Summation Index is an internal indicator that is a mix of breadth and volume. It is now at the highest level in 5 years after being at the lowest level in 10 years. Hard to see this continue but keep in mind this typically starts to fall ahead of the indexes
|
|
|
|
|
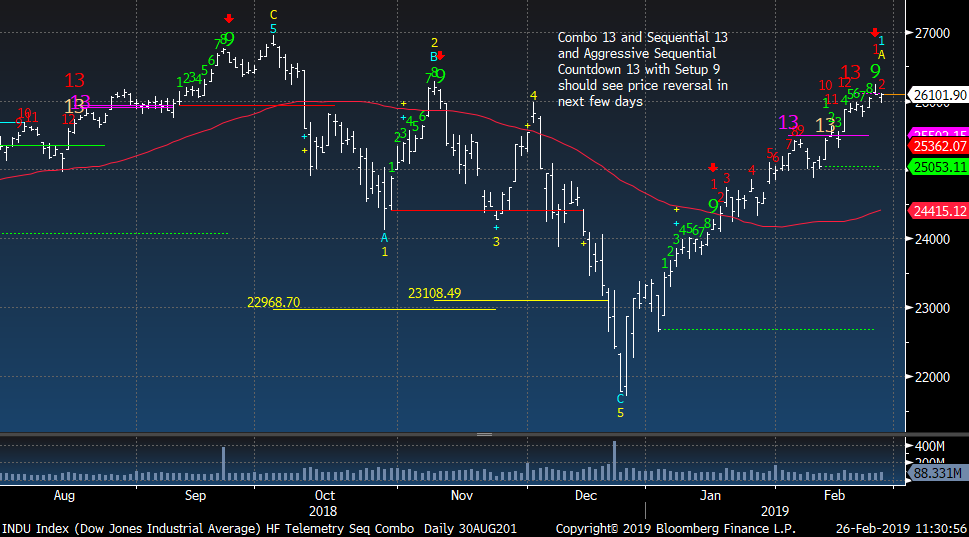
Dow Jones Industrial Average needs a price flip down
|
|
|
|
|
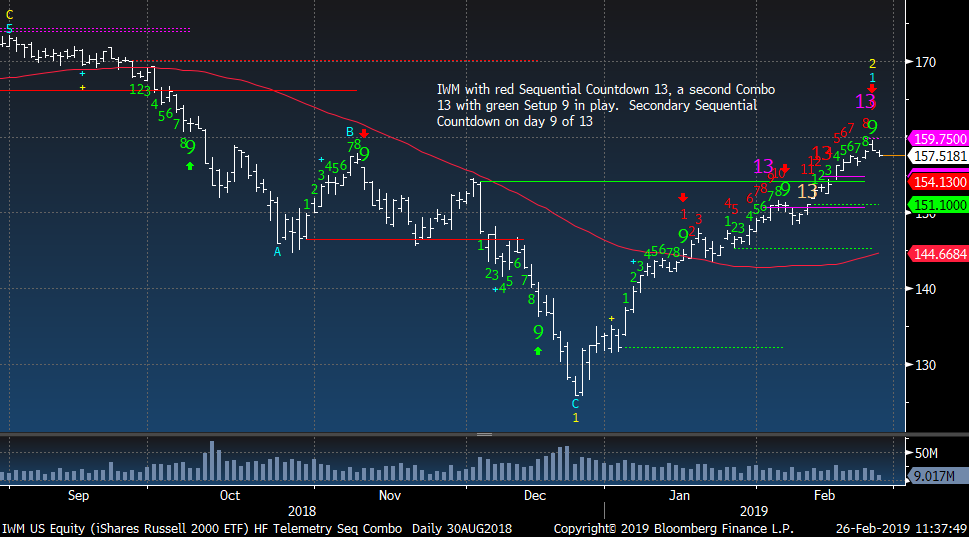
IWM Russell 2000 actually down a little more than the other indexes
|
|
|
|
|
|
|
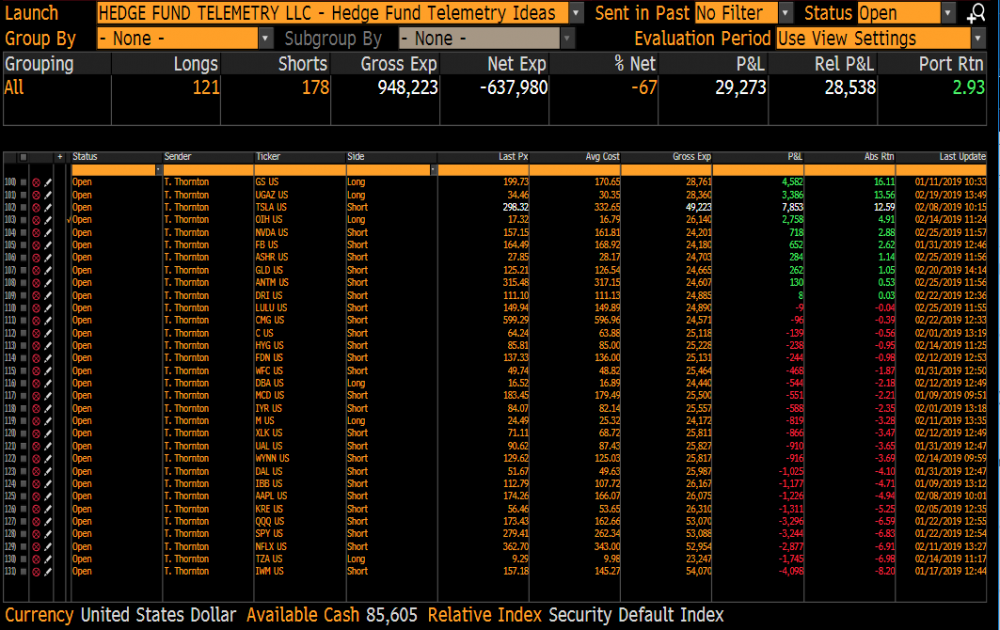
Hedge Fund Telemetry Trade Ideas
|
|
|
Trade Ideas Changes: NO CHANGES. IF YOU WANT A
HEDGE DO A LITTLE OF THE MAY SPY 275/255 ~$3.00. QQQ 170/160 ~$2.00. IWM 155/145 ~$1.70. FYI THE LAST INDEX PUT SPREAD HEDGES DID NOT WORK. DON'T GO CRAZY WITH YOUR SIZE.
|
|
|
|
|
|
|
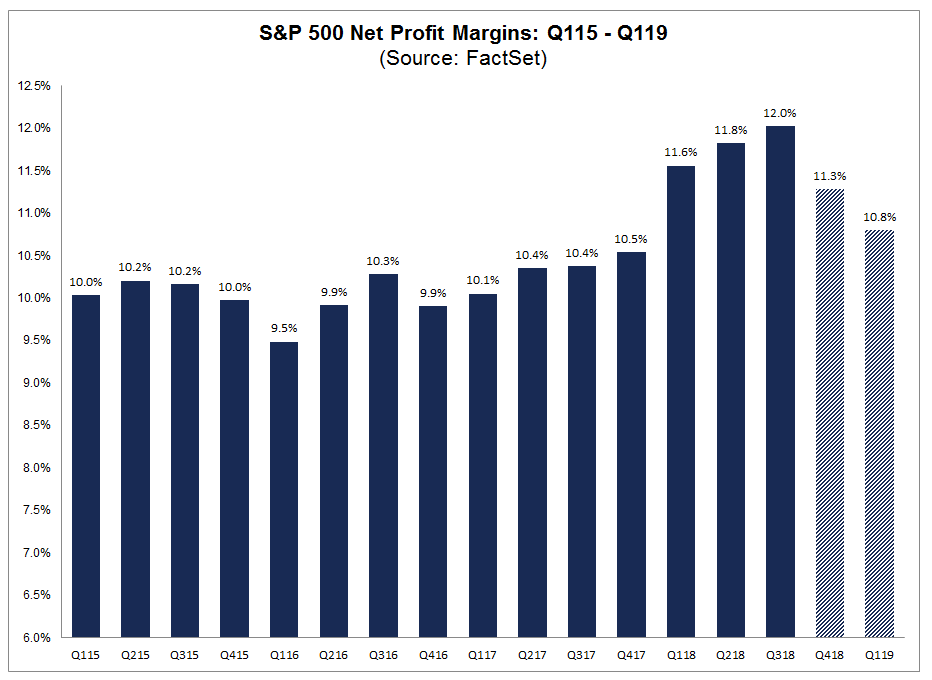
Earnings growth and Margins
|
|
|
Peak profit margins after the sugar high tax reforms
|
|
|
|
|
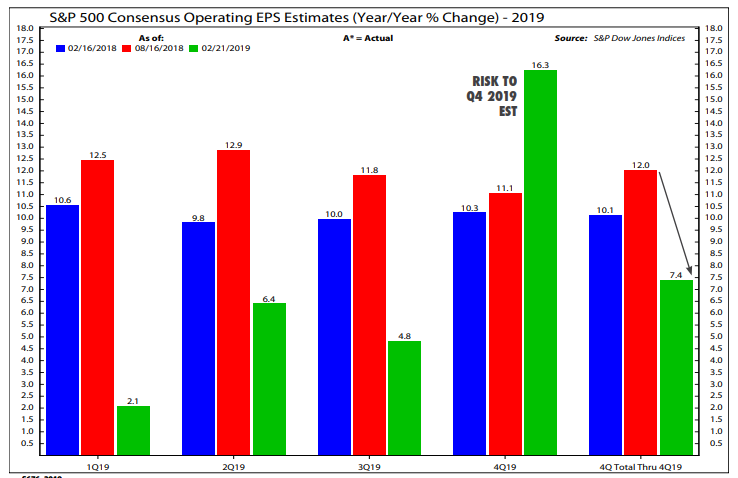
EPS earnings continue to drop so lets see how the beat rate is in April after the big drop.
|
|
|
|
|
Ned Davis EPS beat rate < 3yr Avg. This actually makes me more nervous
|
|
|
|
|
Attribution from 2/8/16 with the SPX and NDX shows the leaders and % of what the attribution within the index. AMZN was over 30% last September of NDX and now it's half. Expect this to continue to drop
|
|
|
|
|
|
|
|
|
|
|
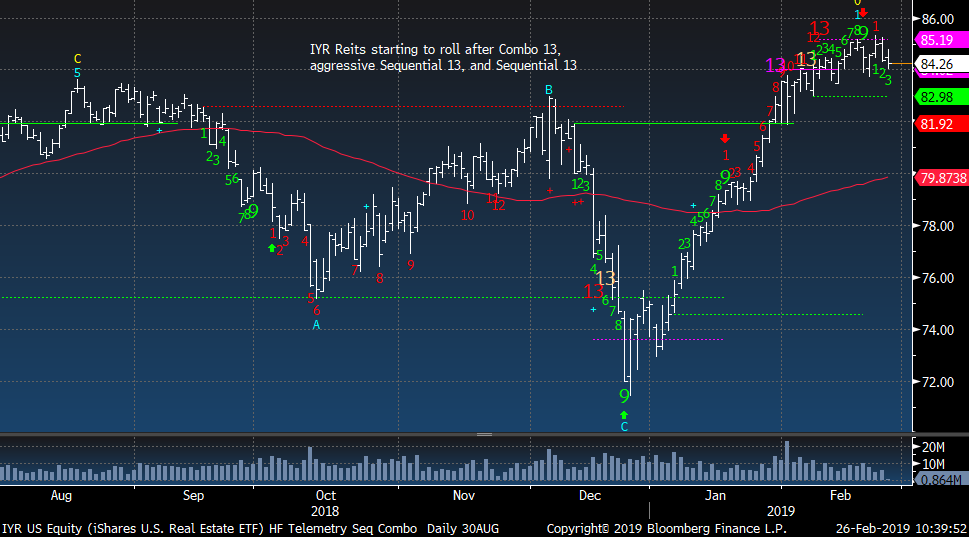
IYR Reits starting to roll after a cluster of upside Countdown 13's
|
|
|
|
|
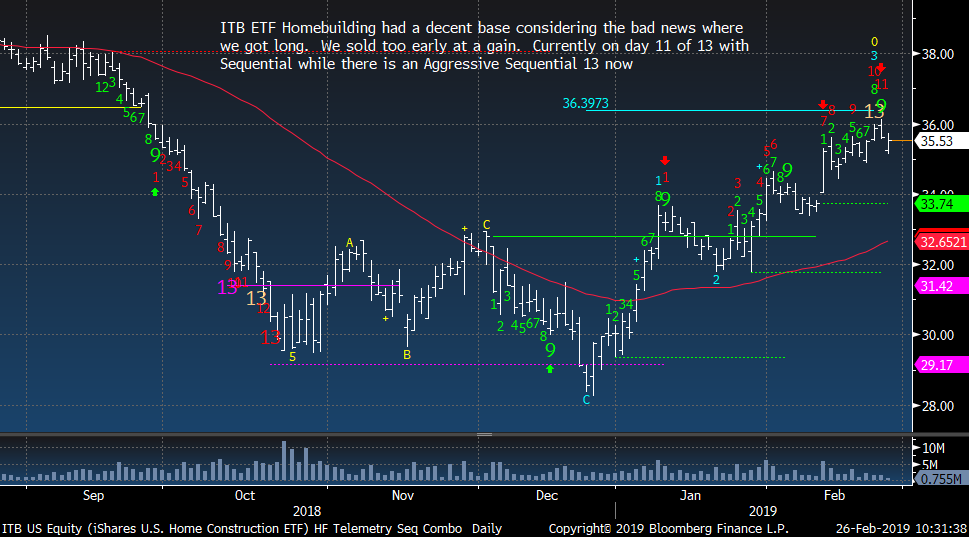
ITB Homebuilding should pullback as it's late in the move up
|
|
|
|
|
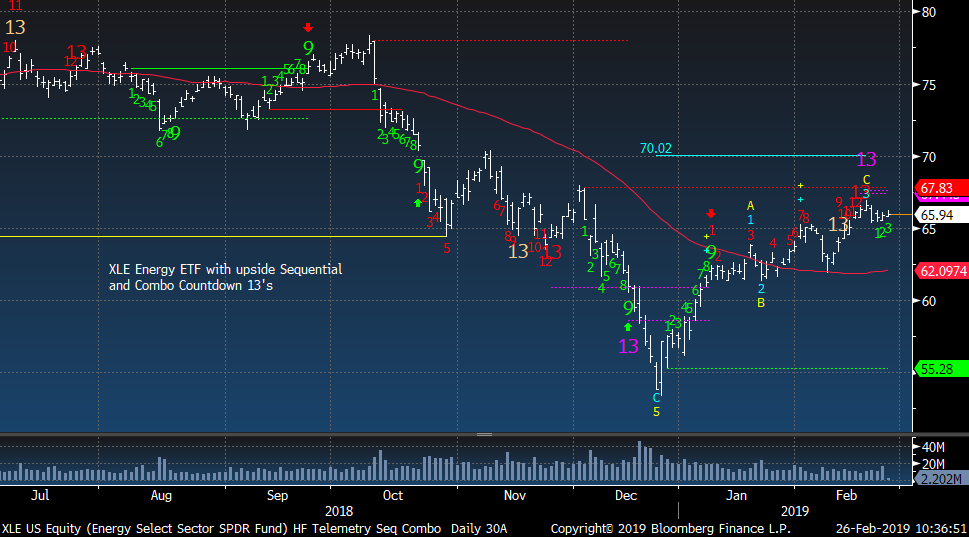
XLE Energy with recent upside Countdown 13's and slight roll
|
|
|
|
|
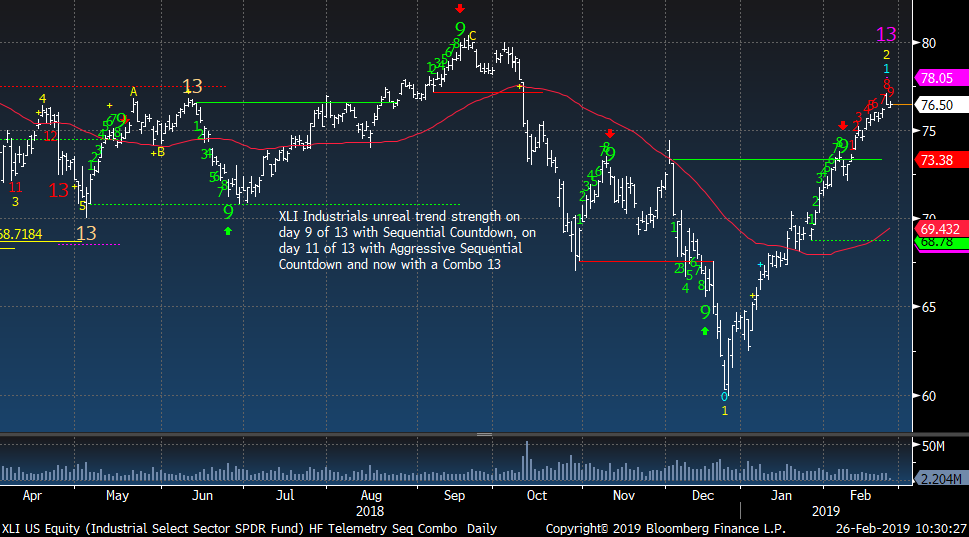
XLI Industrials with a Combo 13 but Sequential still pending
|
|
|
|
|
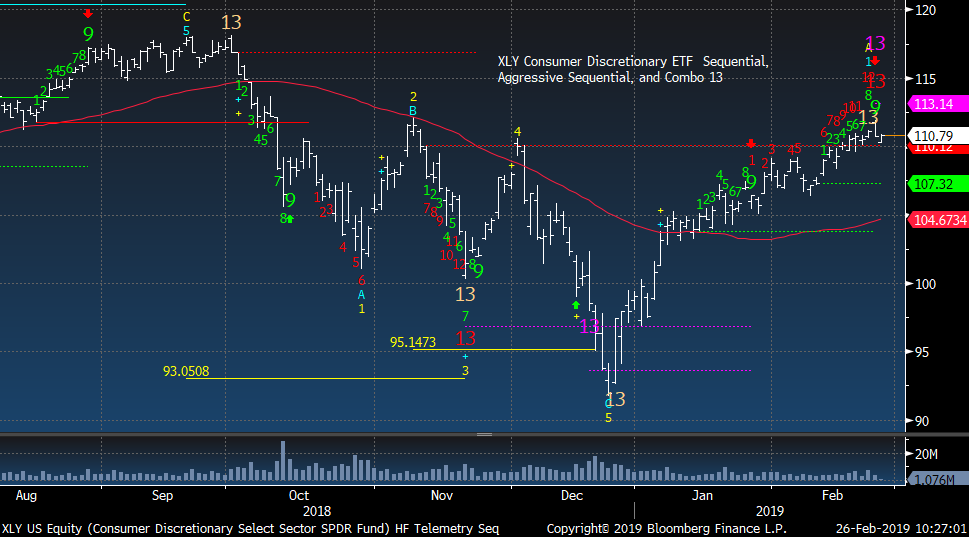
Consumer Discretionary with some Countdown 13's
|
|
|
|
|
|
|
|
|
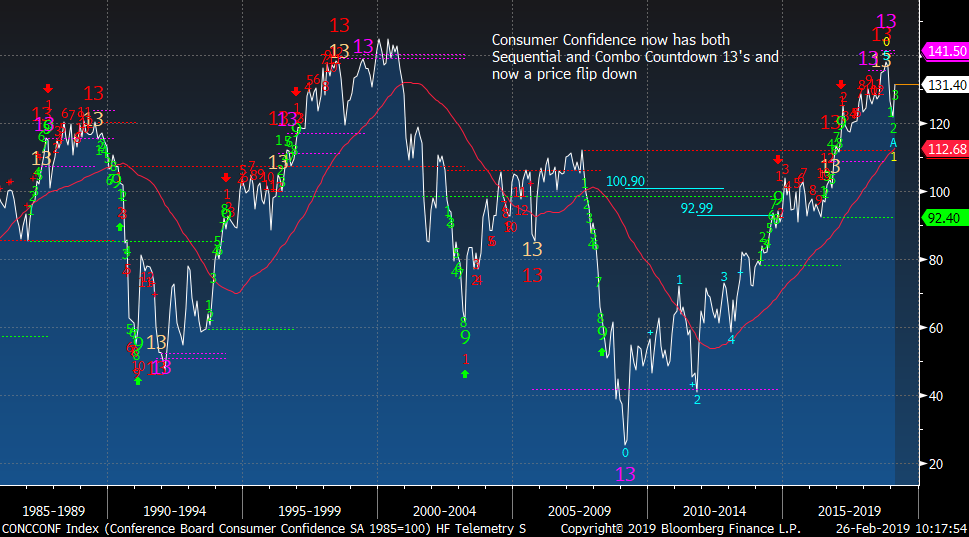
Consumer Confidence Monthly chart had recent upside exhaustion signals but it did bounce in on today's reading. Tops tend to take time
|
|
|
|
|
|
|
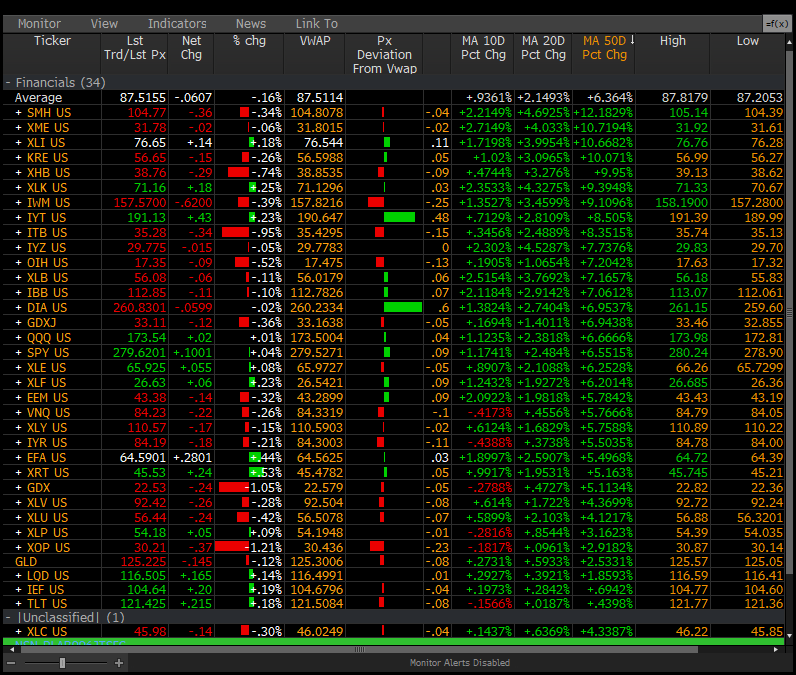
PPO Monitor - Percentage Price Oscillator
|
|
|
The PPO Monitor is a proprietary monitor developed to force rank Indexes, Sectors, and Stocks. It ranks top down by strongest to weakest by percentage above/below the 50 day moving average. Shorter term signals can be seen when the 10 and 20 day moving averages turn up (green) or down (red) which often are followed by the 50 day moving average. This is useful to watch for historically overbought/oversold percentage above/below the 50 day moving
average. It is non correlated with the DeMark Indicators however we have found upside/downside exhaustion signals often occur when something rises to the top or drifts to the bottom of the monitor - increasing the timing aspect. We share this monitor with clients with Bloomberg Terminals. An added feature is that each market/ETF can be expanded with each component force ranked in the same way. A couple other features include price deviation from intraday VWAP (useful for intraday reversals) and new 20 day highs/lows on right side. Please inquire if you would like to be permissioned to use the PPO Monitor.
Today's highlights: seeing some weakness and a lot below the intraday VWAP. Supply coming in.
|
|
|
|
|
|
|
|
|
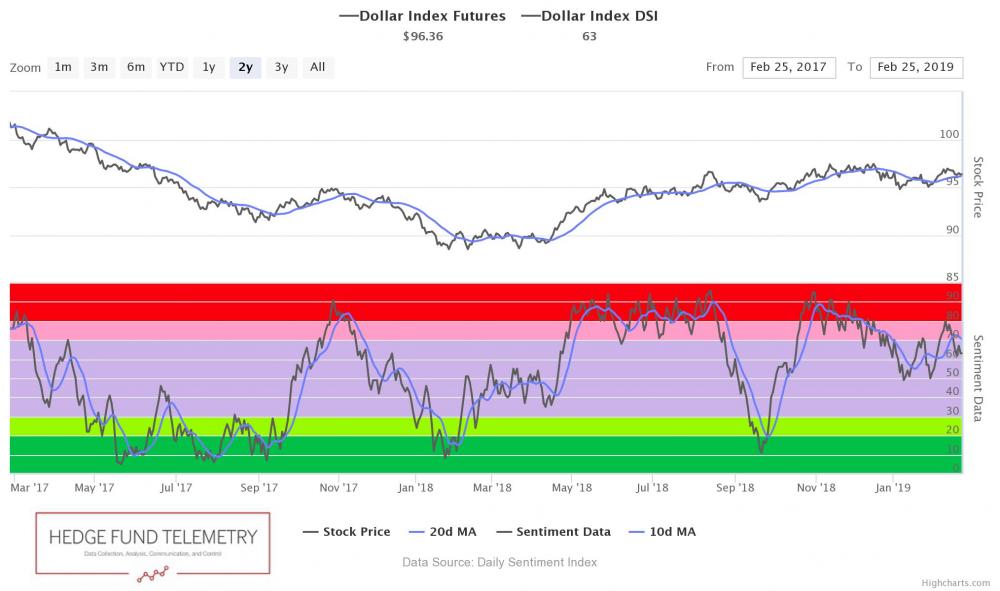
US Dollar bullish sentiment is at 63%
|
|
|
|
|
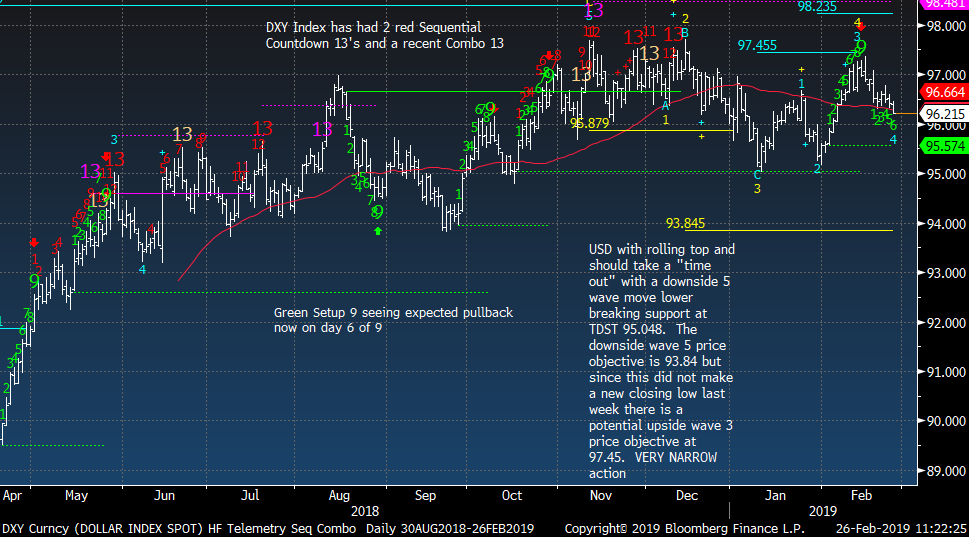
US Dollar Index still in a tight range. Watch 95.57 support
|
|
|
|
|
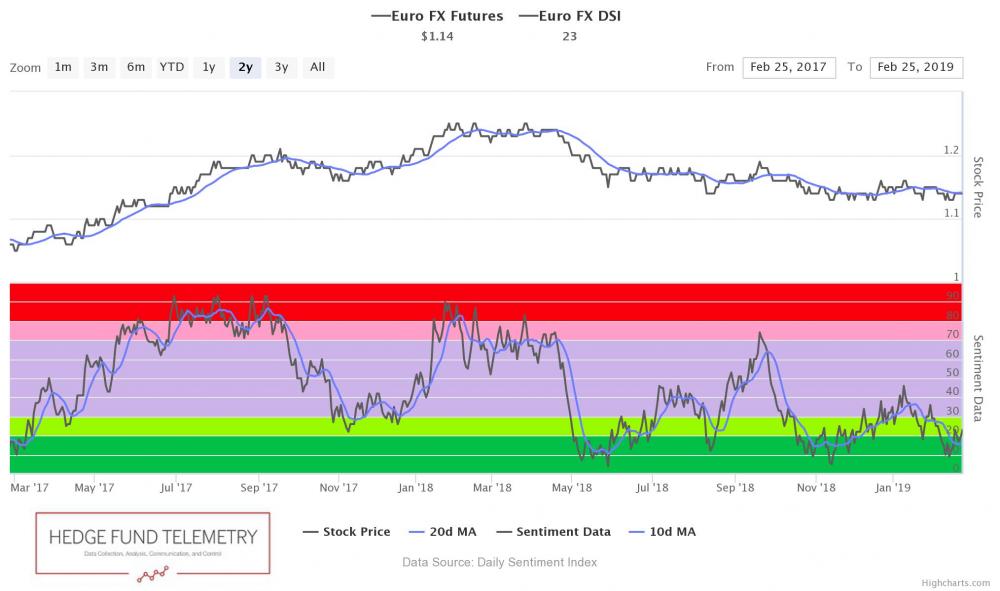
Euro bullish sentiment is at 23%
|
|
|
|
|
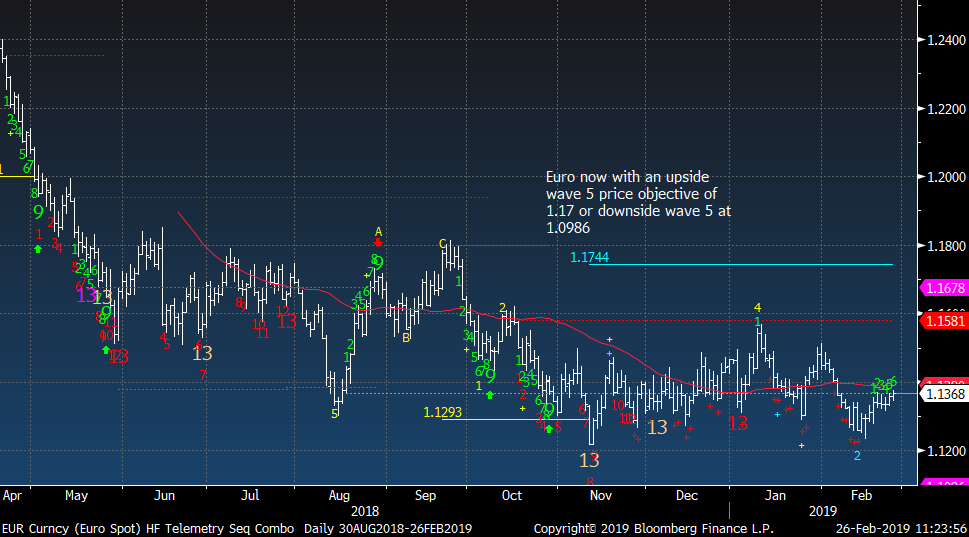
Euro Spot nothing to do here
|
|
|
|
|
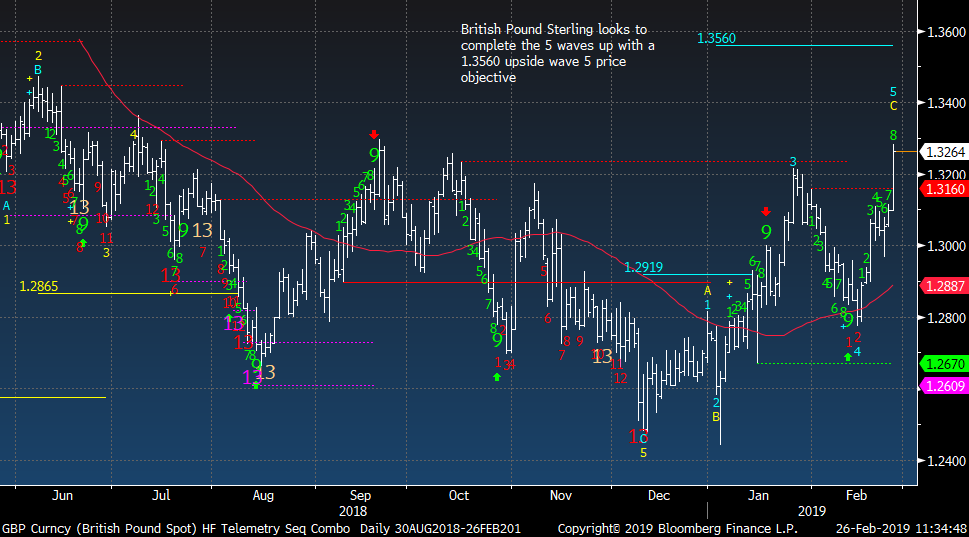
British Pound Sterling in wave 5 now on the upside.
|
|
|
|
|
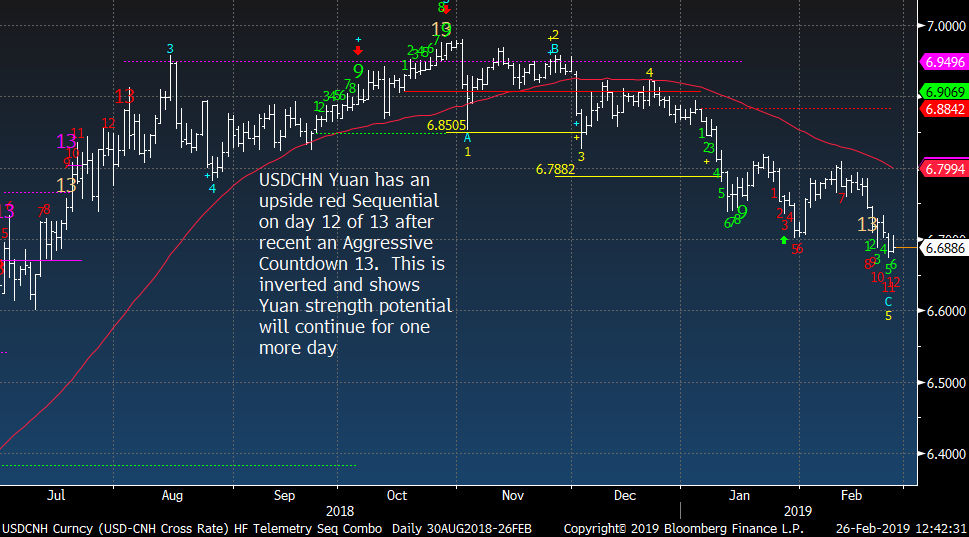
China Yuan could make a direction change in the next couple days
|
|
|
|
|
|
|
|
|
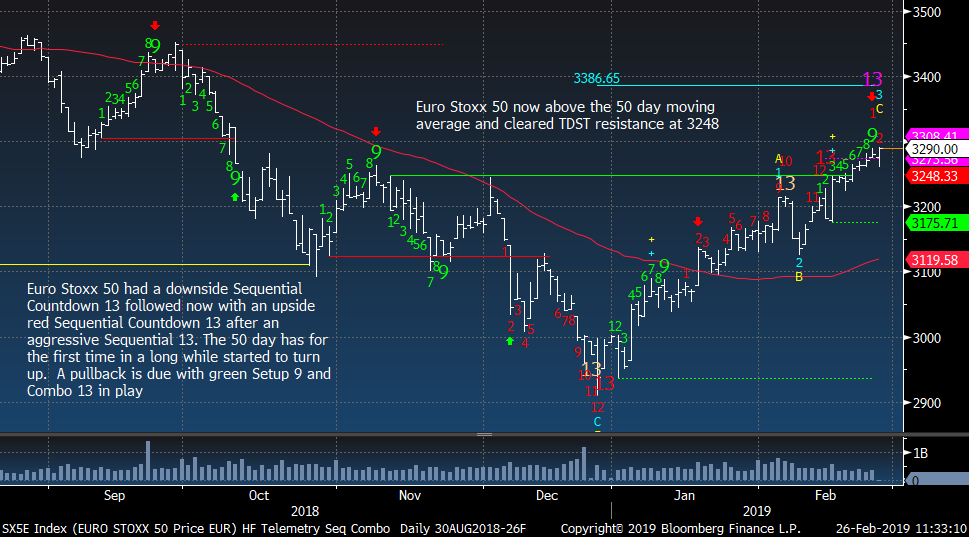
Euro Stoxx 50 with a Combo today
|
|
|
|
|
|
|
|
|
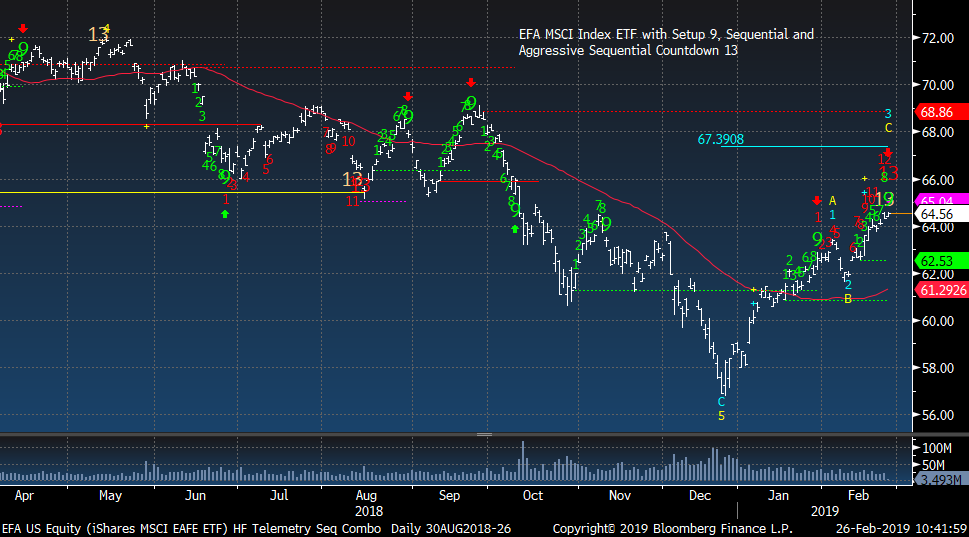
EFA MSCI Index ETF with a Countdown 13 and Setup 9 today
|
|
|
|
|
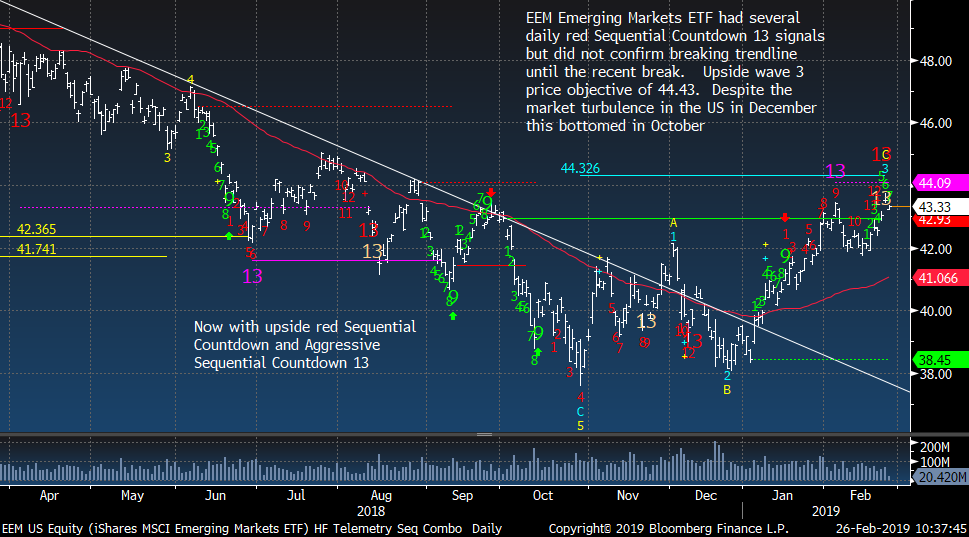
EEM Emerging Markets ETF should pull back here
|
|
|
|
|
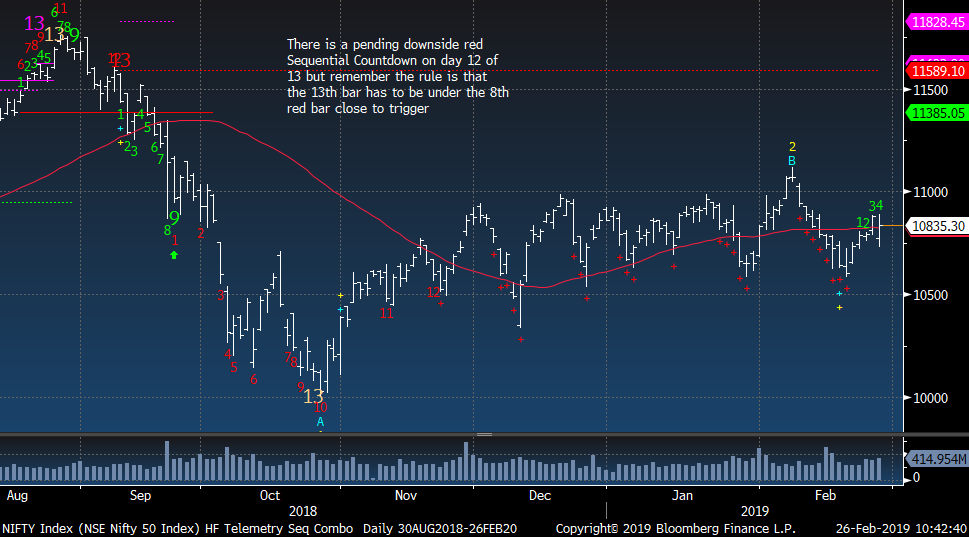
Nifty 50 Index in India still sideways despite the geo political tension with Pakistan
|
|
|
|
|
|
|
|
|
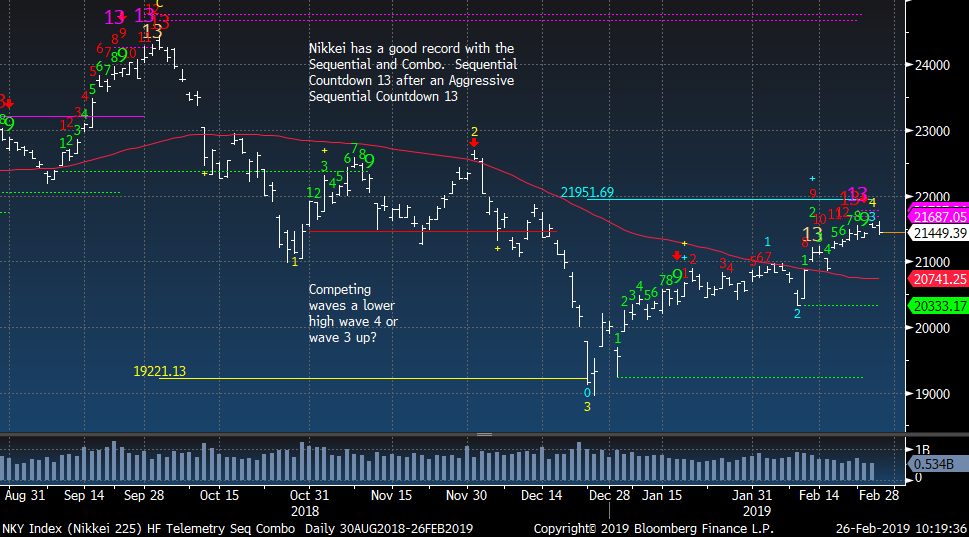
Nikkei should roll over here
|
|
|
|
|
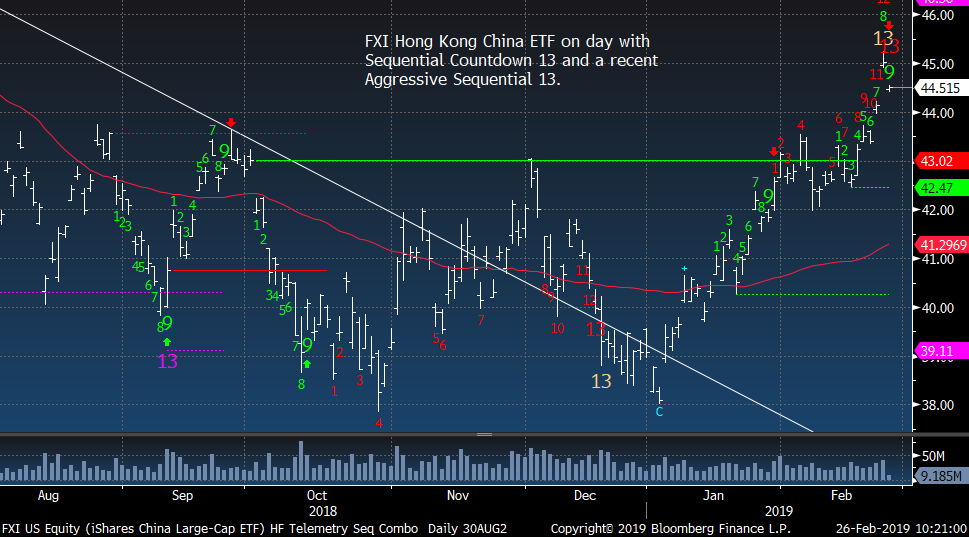
China / Hong Kong FXI ETF upside Countdown 13. Sell
|
|
|
|
|
|
|
Crude and Natural Gas Update
|
|
|
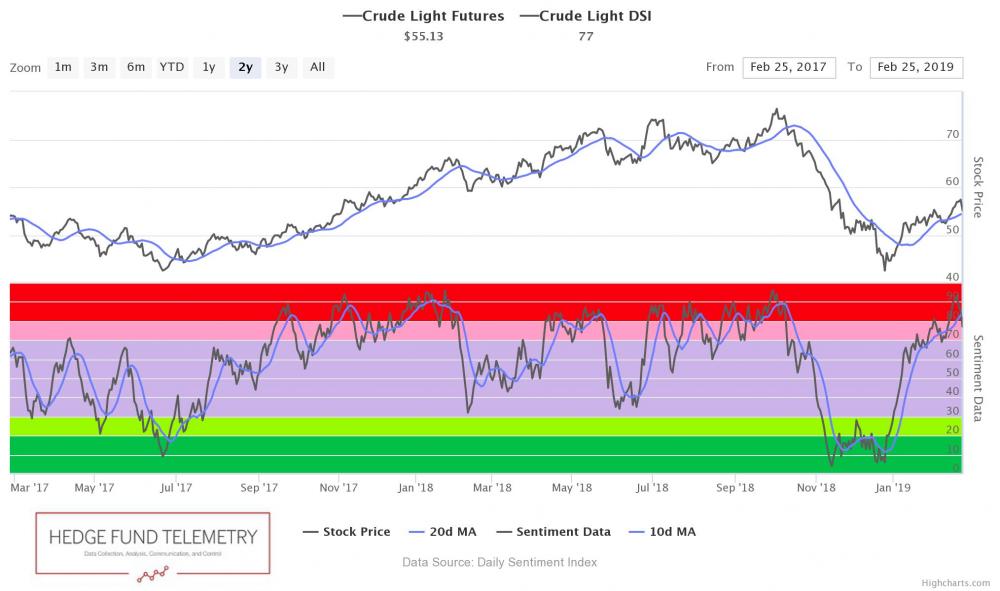
Crude bullish sentiment is at 77% and still needs to consolidate
|
|
|
|
|
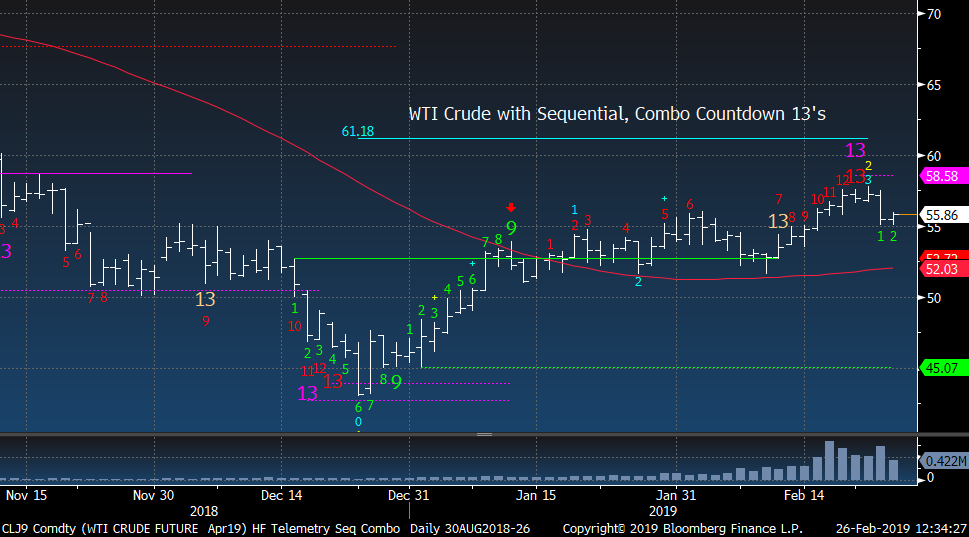
WTI Crude Futures should back off a little more
|
|
|
|
|
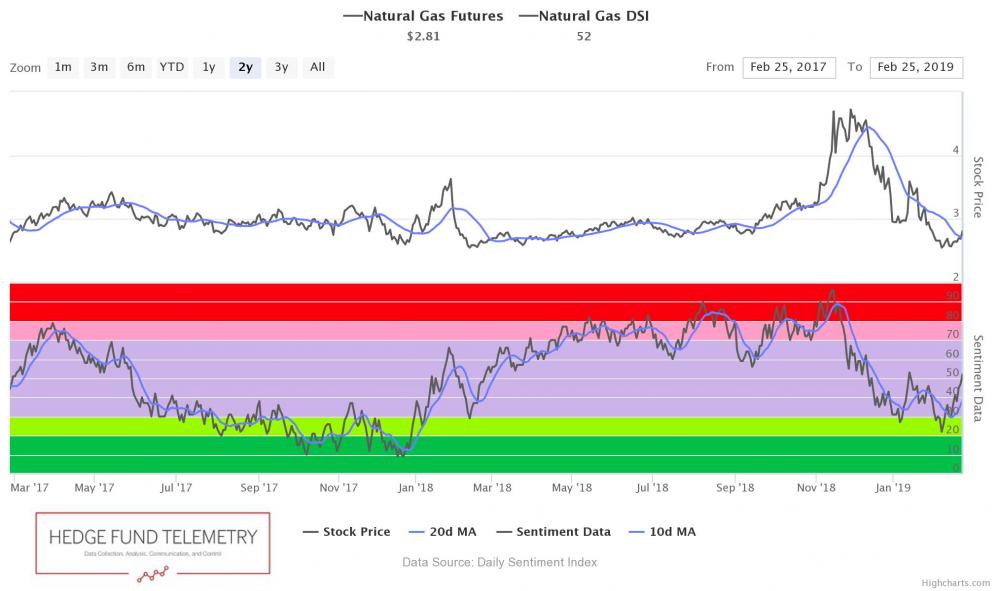
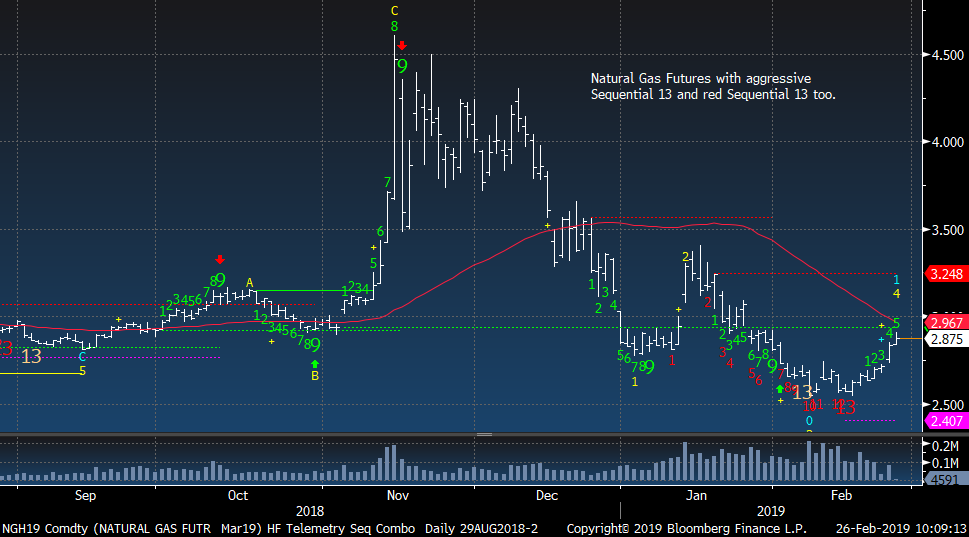
Natural Gas bullish sentiment at 52% and it's make or break now
|
|
|
|
|
Natural Gas continues to trade well after recent downside Countdown 13. Positive seasonality in March is ahead
|
|
|
|
|
|
|
|
|
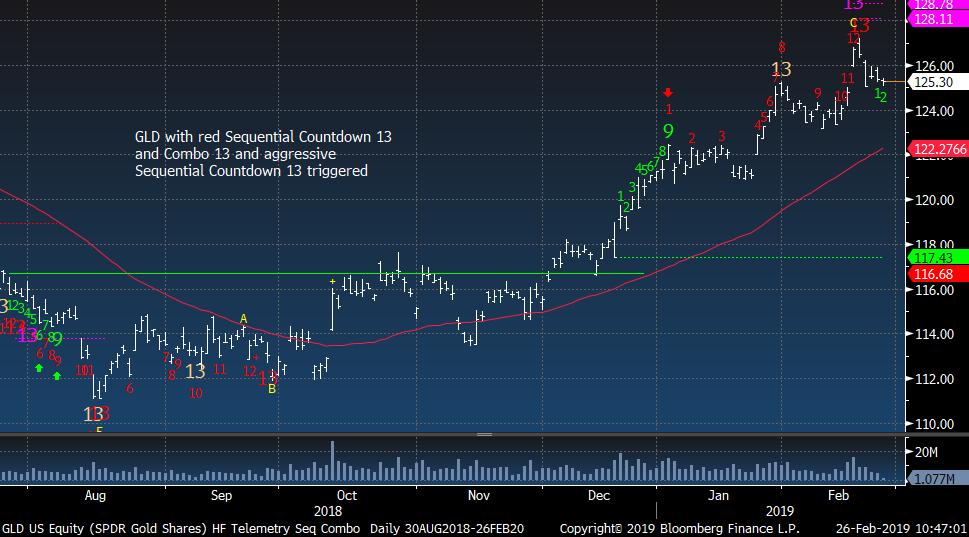
Gold slight roll over. I expect a move at least to the 50 day
|
|
|
|
|
|
|
|
|
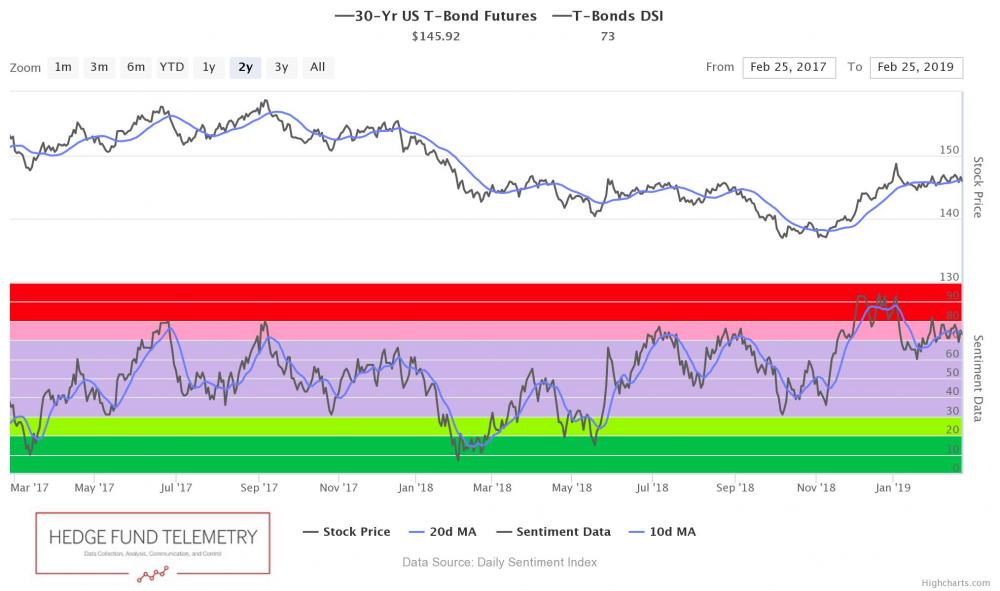
Bond bullish sentiment is at 73% still elevated
|
|
|
|
|
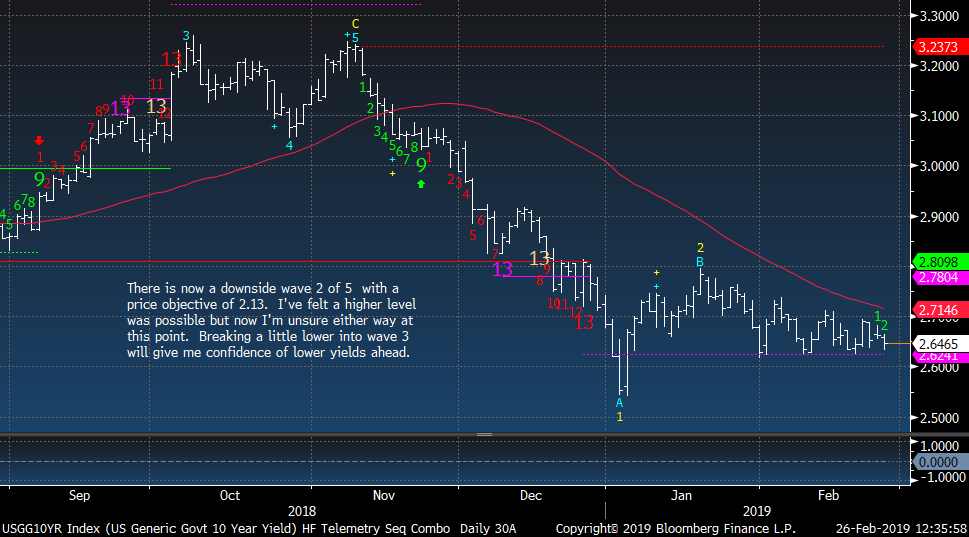
US 10 Year Yield sideways still
|
|
|
|
|
|
|
Unsubscribe me from Hedge Fund Telemetry
Hedge Fund Telemetry LLC, P.O. Box 4675, Greenwich, CT 06861, United States
CONFIDENTIALITY NOTE and DISCLAIMER: This message is for the named person's use only. It may contain confidential, proprietary or legally privileged material. No confidentiality or privilege is waived by any accidental or unintentional transmission. If you receive this message in error, please immediately delete it and all copies of it from your system, destroy any hard copies and notify the sender. You must not, directly or indirectly, use, disclose,
distribute, print or copy any part of this message if you are not the intended recipient. Hedge Fund Telemetry LLC. cannot guarantee the confidentiality of the material transmitted; therefore, information of a sensitive or confidential nature should not be transmitted. There is risk in trading markets. Hedge Fund Telemetry LLC reports are based on information gathered from various sources and believed to be reliable, but are not guaranteed as to accuracy and completeness. The information is subject to change without notice and Hedge Fund Telemetry LLC has no obligation to provide any updates or changes. Hedge Fund Telemetry LLC is providing this data for informational and educational purposes and does not believe that it is sufficient to base an investment decision on. This information should not be regarded as a solicitation or recommendation of any particular security or to engage in any trading strategy. One should always check with your licensed financial
advisor to determine suitability of any investments.
|
|
|
|
|