|
|
|
|
|
|
The April Fool's day jokes
|
|
|
The equity markets are strong today to start off the 2nd quarter the same way it ended. China data was better than expected but more so it is being spun HARD that China is back in business. Perhaps so after China has unleashed A TON of stimulus it is not a surprise you're going to see some improvements in data. South Korea, Japan and some European macro data came in today on the other hand very weak as they didn't get their central bank to give them the stimulus
like China. But China news is all that matters today globally! China A Shares Index also has an upside DeMark Countdown 13. So does Copper today which has a decent correlation.
In the US the bond market rally looks to be over for now (after 93% bullish sentiment) and the usual suspects which like higher yields (financials mostly) are rallying hard. The US markets are making new highs on some indexes for the year while upside DeMark Countdown 13's are triggering or are within a few days. But the joke could be on investors as they are late again with inflow data (fear of missing out) and earnings estimates continue to drop with a year over year decline in earnings for the quarter. The overall narrative is there is a "second half recovery" ahead especially in semiconductor sector where inventories are at near 20 year highs for some companies and pricing continues to plummet BUT the semiconductor stocks are making highs! This is the "greatest
economy ever" according to the current administration but we "NEED RIGHT NOW the Fed to cut rates 50bps" is the political talk with the S&P within 4% of an all time high and the unemployment rate under 4%. This is not a joke, they actually believe it. There is a major fiscal stimulus coming that is being discussed around Washington DC. Deficits? No big deal as long as the markets stay up and both parties get the goodies for their constituents. MMT is quietly starting to happen. AOC, the left's new darling, is on the cover of Time Magazine! (April 1st is the date on the issue) I was a speaker at Harvard this weekend and I hung out with Julian Brigden, who is a smart macro investor with a keen take on the Fed and Central Banks. His belief was that the US Government and the Fed were going to do EVERYTHING to extend the market cycle even it's crazy. He's probably right. I think people have lost their friggen minds.
Some specific
stories that caught my eye too also seem like April Fool's jokes. FB's Zuck pens a piece on how he wants Government regulation on the internet (be careful for what you wish for Mark). Apple cut earnings guidance more than expected in early January but the stock is up 40% from the low and today they cut prices in China by 6% and the stock is up. Lyft goes public as the first of the Unicorn IPO's for 2019 and the stock is down 20% off Friday's high and on top of that it broke the IPO price while CNBC has a rapper on discussing his investment in the company. US Retail Sales numbers were horrible for February but the market ignores one of the better macro indicators in the US. Crude prices are inching higher too which should weigh on the retail sector as it works like a tax on the consumer as prices increase.
My view on the current state of markets and rationalizations seems more like a joke that if you told people are few years ago all this stuff
would be discussed and proposed and what is actually happening they never would believe it. There have been other periods when I looked at the markets in a similar way and the joke was always on the investors who bought the joke.
|
|
|
|
|
|
|
|
|
|
|
|
|
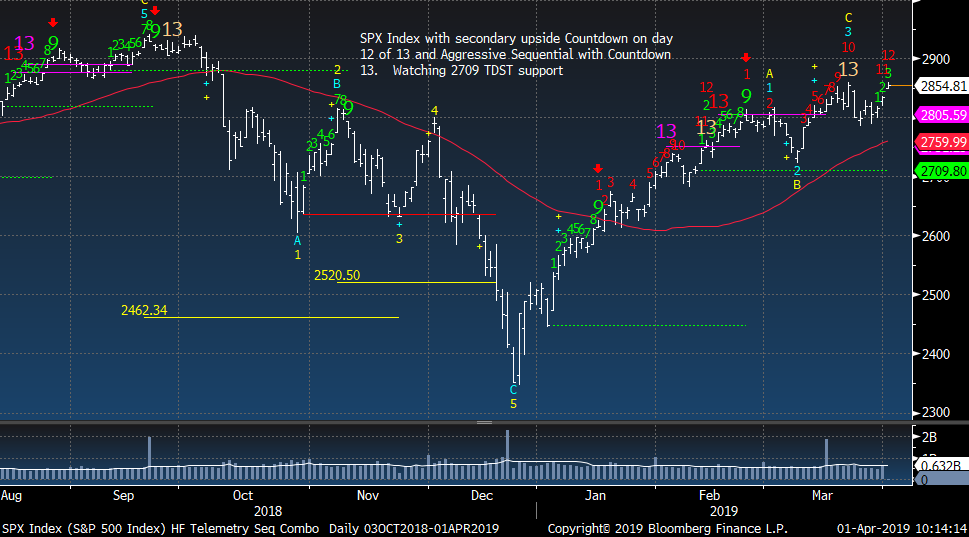
SPX daily now on day 12 of 13
|
|
|
|
|
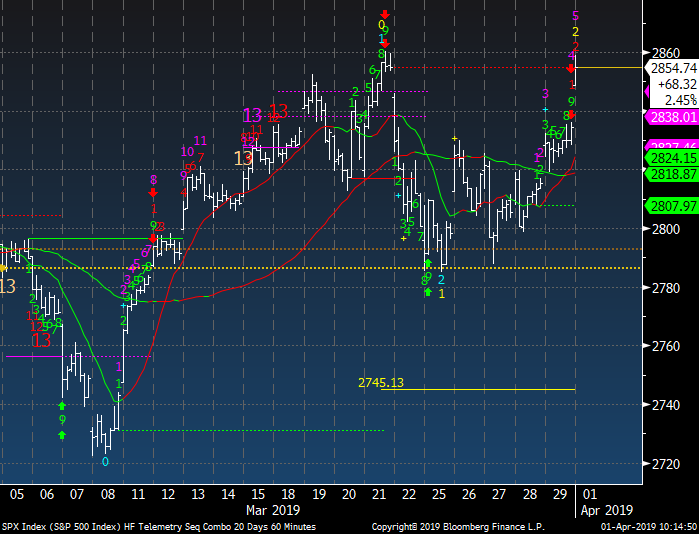
SPX 60 minute tactical time frame still slightly below last week's high
|
|
|
|
|
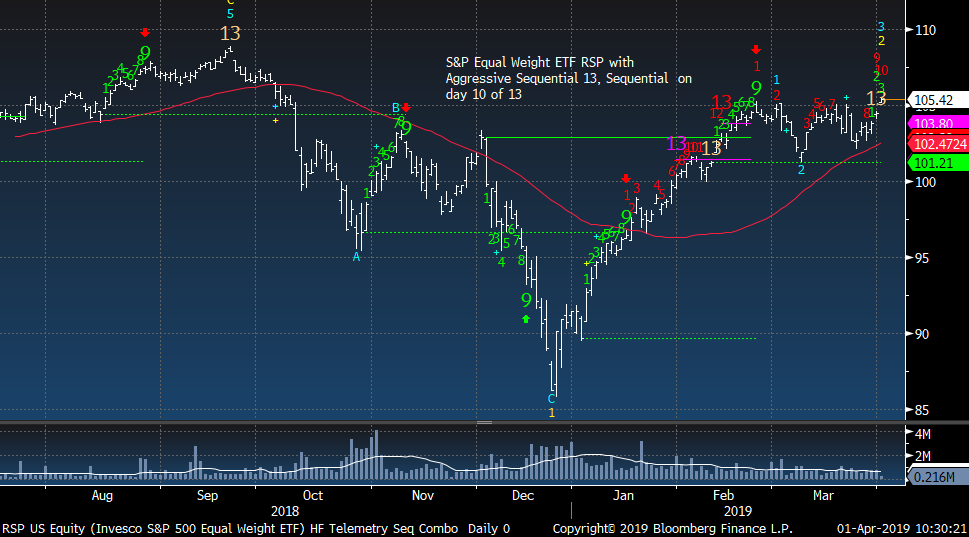
S&P Equal Weight ETF on day 10 of 13 and with an Aggressive Sequential (in amber)
|
|
|
|
|
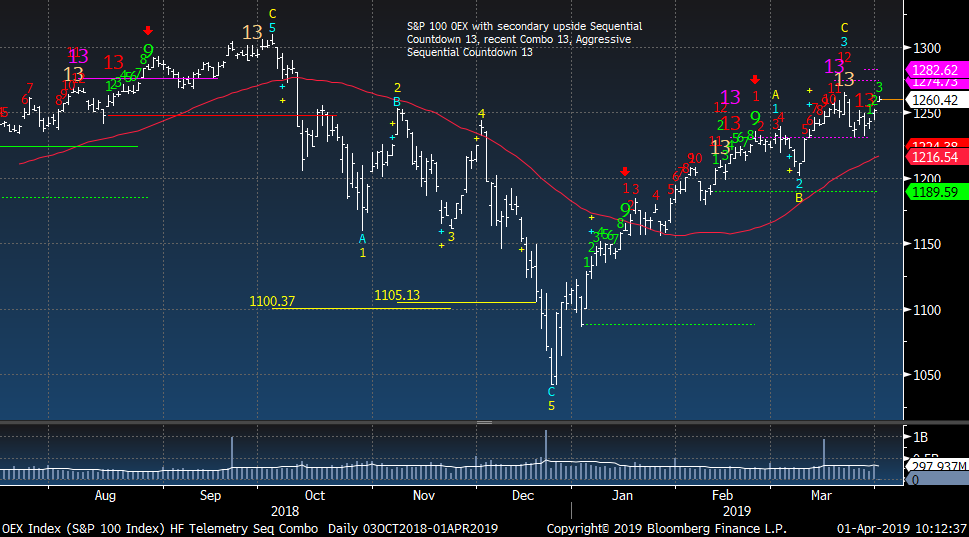
S&P 100 with several Countdown 13's. When I see these start to cluster like this my conviction increases for a reversal soon
|
|
|
|
|
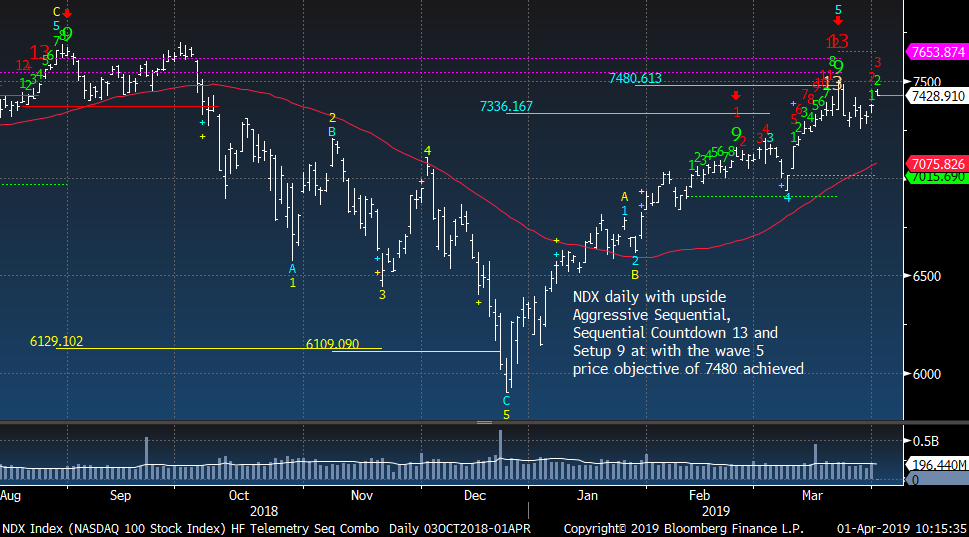
NDX Index had several upside Countdown 13's and has a secondary upside Countdown on day 3 of 13. I'm going to stick with recent upside Countdowns to work lower vs the new potential Countdown.
|
|
|
|
|
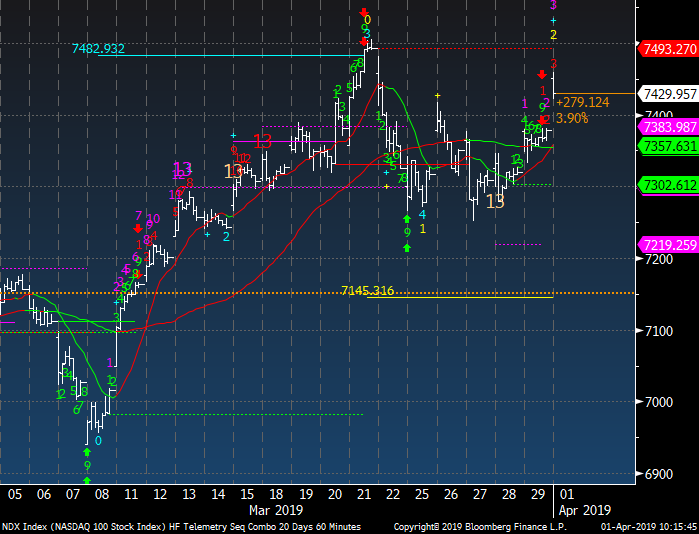
NDX 60 minute tactical time frame also slightly below last week's high
|
|
|
|
|
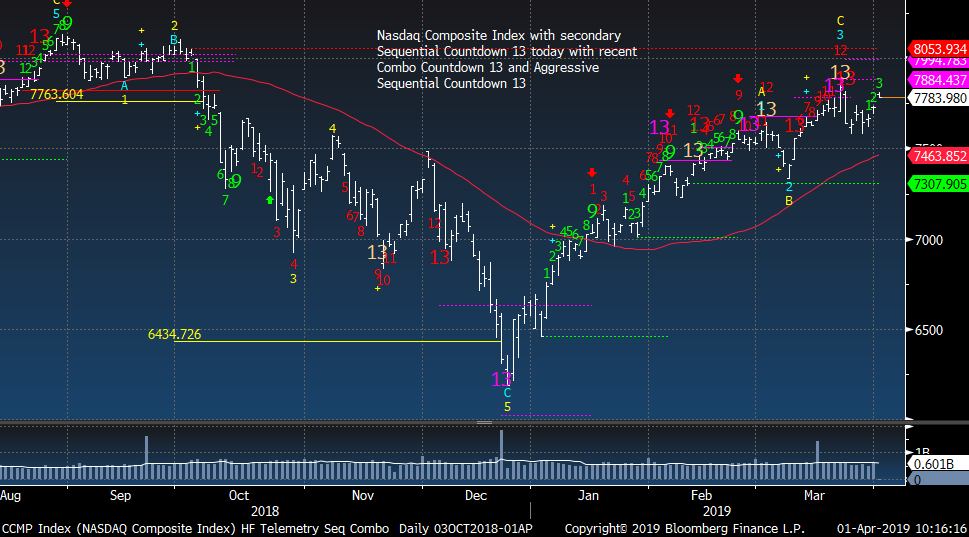
Nasdaq Composite Index clusters of Countdown 13's
|
|
|
|
|
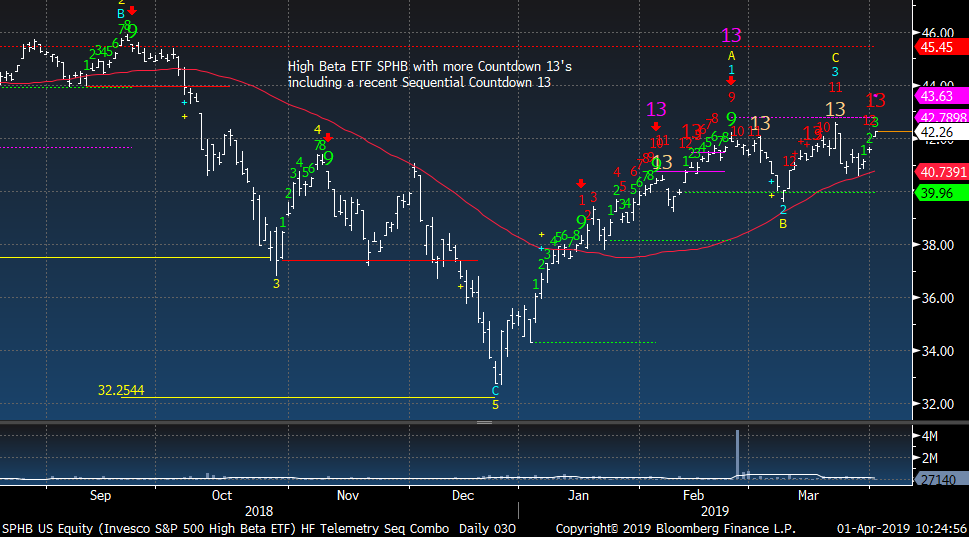
High Beta ETF with another Sequential Countdown 13
|
|
|
|
|
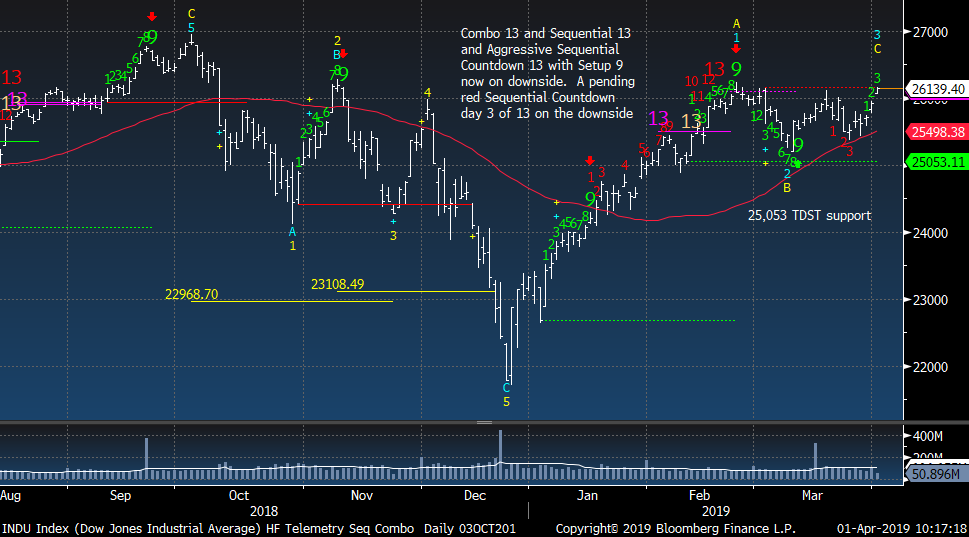
Dow Jones Industrial Average drifting higher but mostly in a 1000 point range
|
|
|
|
|
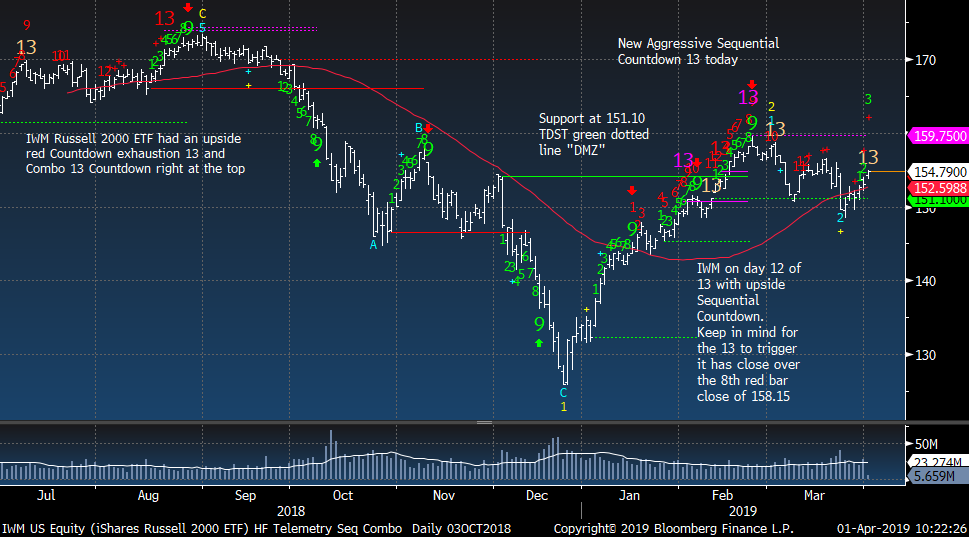
IWM Russell 2000 with an aggressive Sequential Countdown 13
|
|
|
|
|
|
|
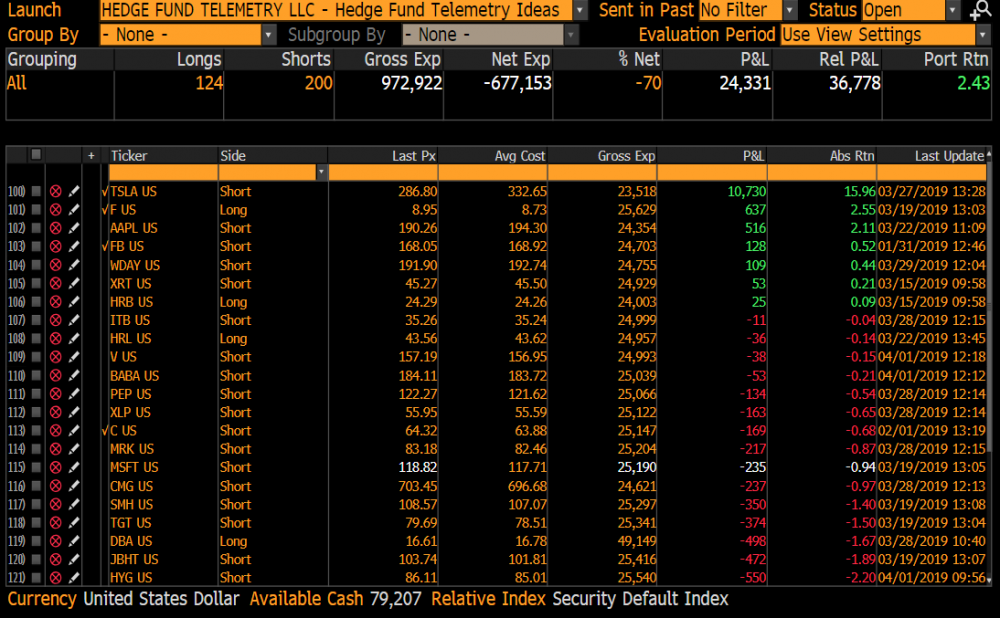
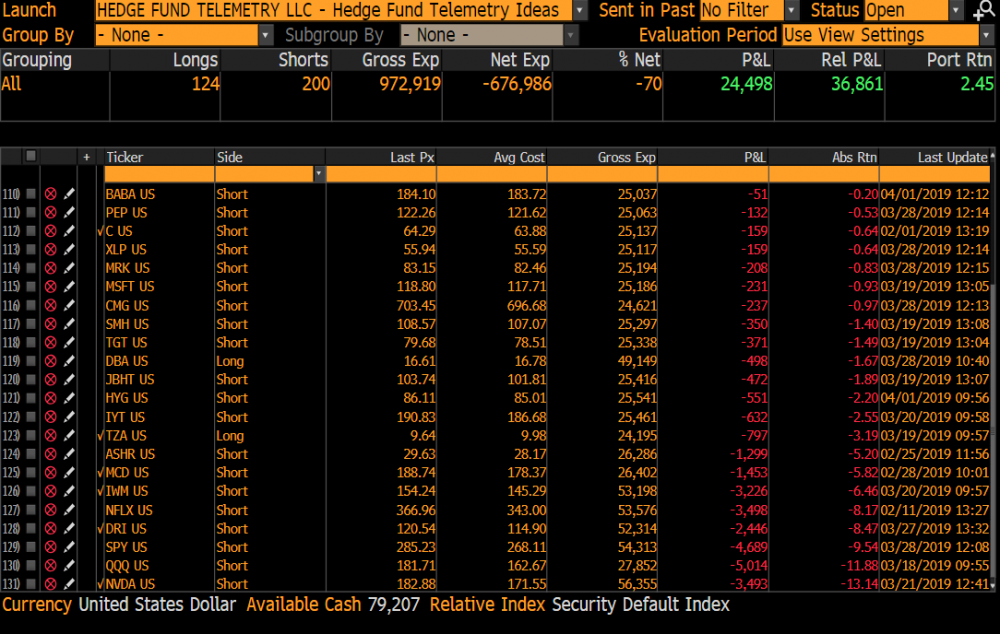
Hedge Fund Telemetry Trade Ideas
|
|
|
Trade Ideas Sheet
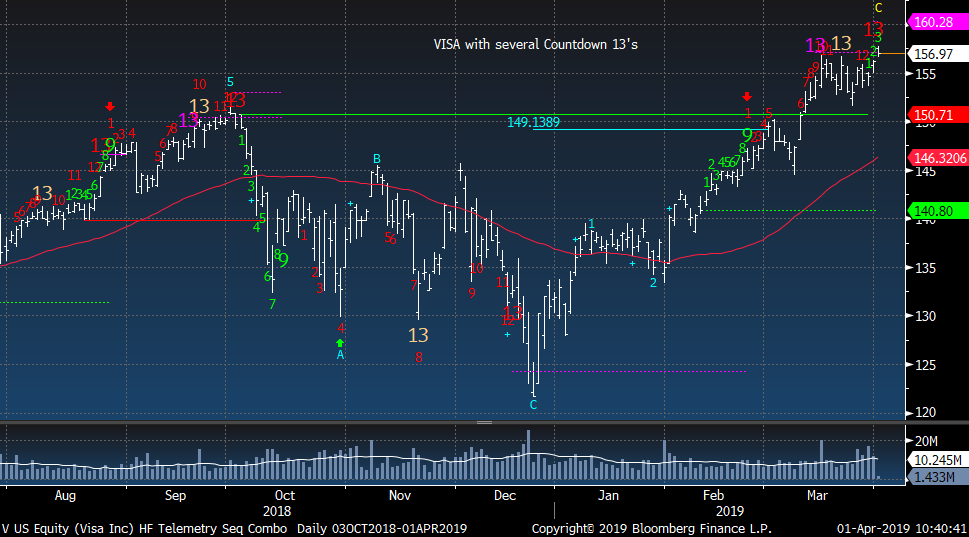
Trade Ideas Changes: COVERING KRE +2%, FDN -3% (JUST HASN'T WORKED) BA +11.5%, ADDING SHORT 2.5% SIZE: V (VISA) AND BABA
|
|
|
|
|
|
|
|
|
|
|
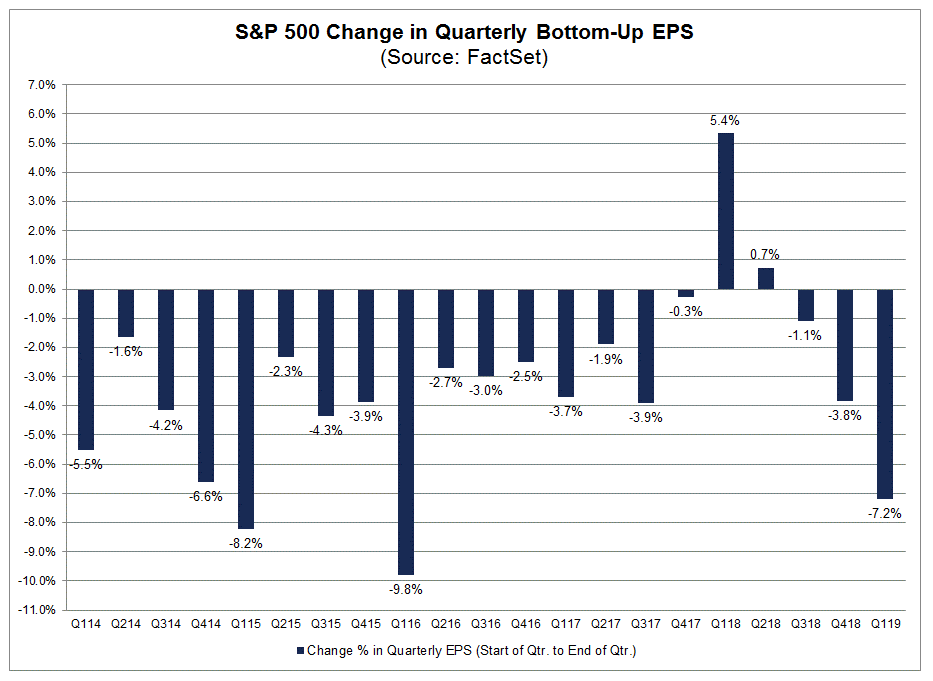
Back in October I started a theme of "guidance cuts" and back then I had some people tell me that it was bullish. The S&P dropped 20% shortly after but EPS cuts continue into this quarter. Back in Q1 2016 when this was at 9.8% the market was going down continuously for 7 months with high yield and small caps destroyed while today the market is nearly at all time highs.
|
|
|
|
|
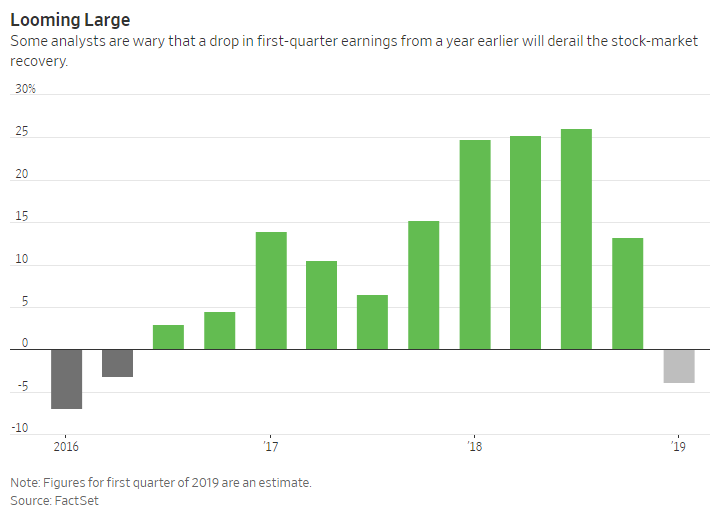
From today's WSJ I spotted this under a story talking about FOMO with investors but year over year earnings are expected to decline. With the narrative of "second half recovery" I believe this pattern of year over year earnings declines will continue and the comps from 2018 will be hard to beat.
|
|
|
|
|
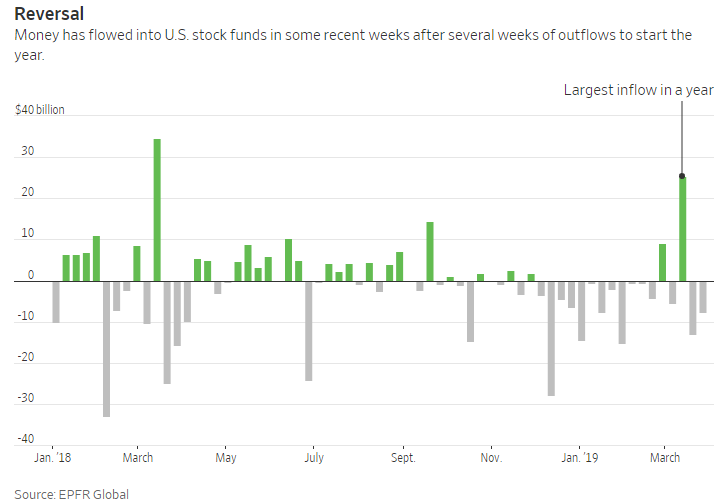
And just as it always happens, a big spike in inflows from Mom and Pop AFTER a 12% upside move
|
|
|
|
|
|
|
Stocks I'm looking at today
|
|
|
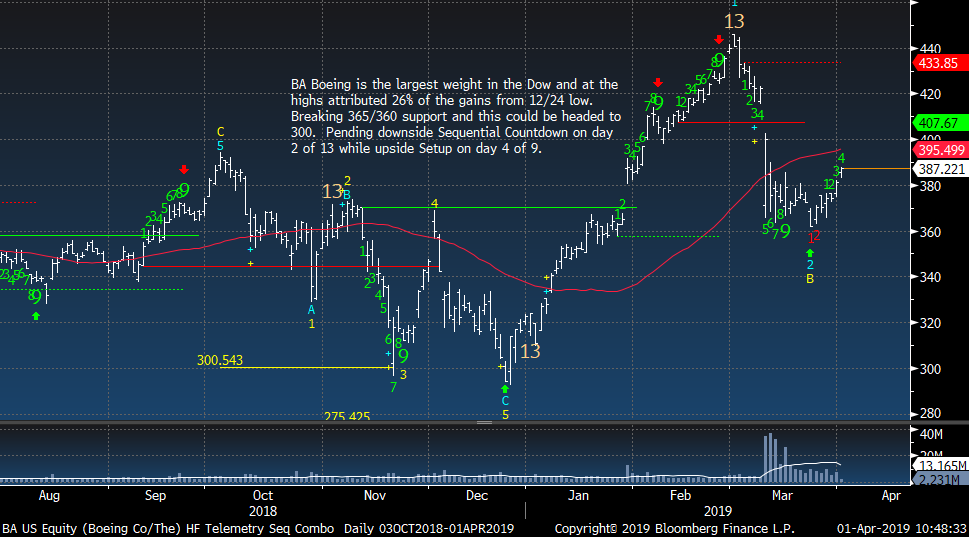
BA has bounced and I'm taking off the other half of the short +11.5%. Still think they have some big problems so I'll watch for another place to short again
|
|
|
|
|
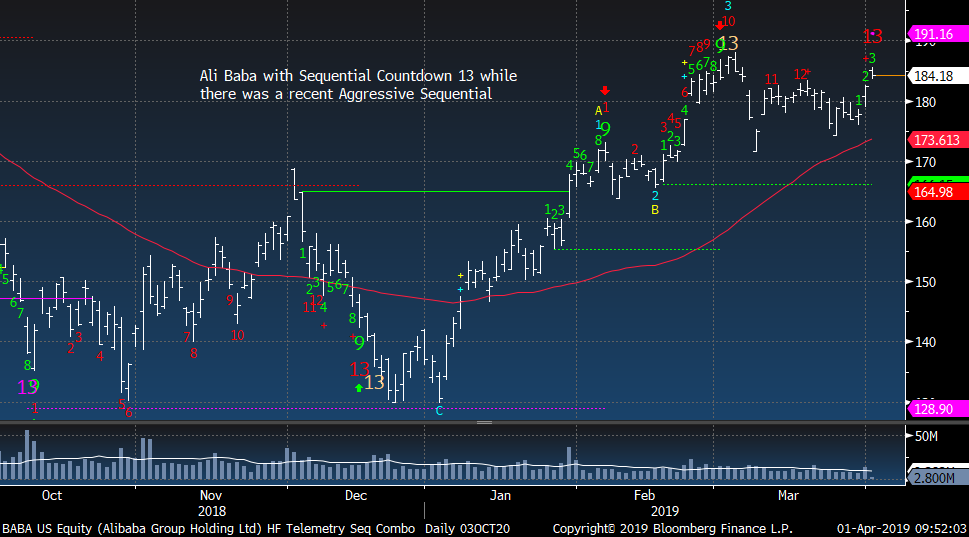
Ali Baba with Countdown 13 today. Adding a 2.5% sized short today
|
|
|
|
|
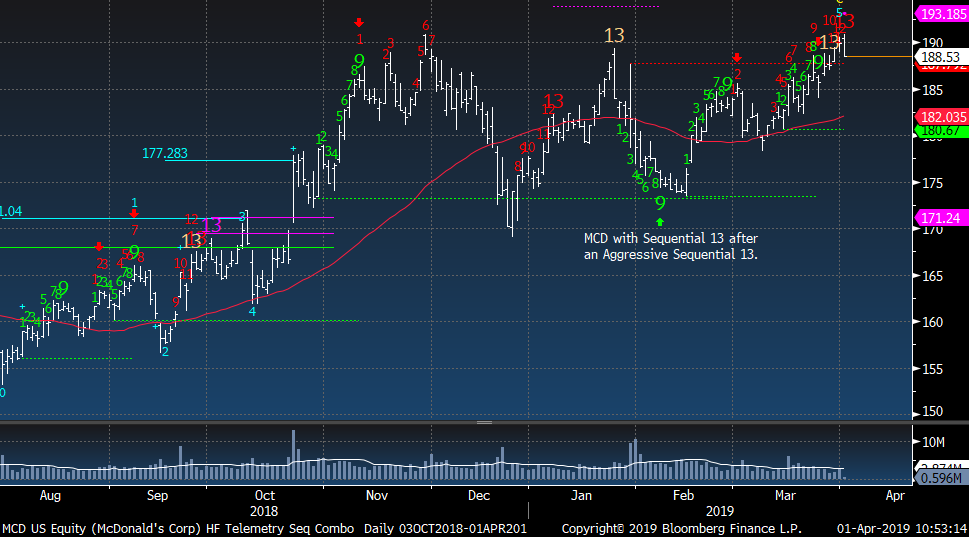
MCD reversing down after Countdown 13
|
|
|
|
|
Visa looks similar to last September with some upside Countdowns. And don't forget retail sales data today was a big miss. Adding as a 2.5% sized short.
|
|
|
|
|
|
|
US Sector Focus - Semiconductors
|
|
|
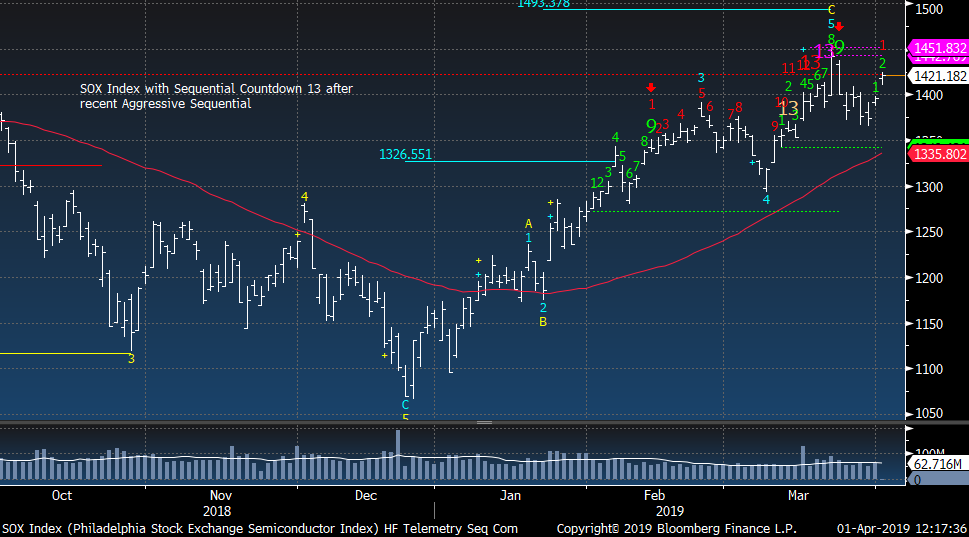
SOX index is higher than October when companies started to warn. People have lost their minds bidding up semi's on a "second half recovery"
|
|
|
|
|
|
|
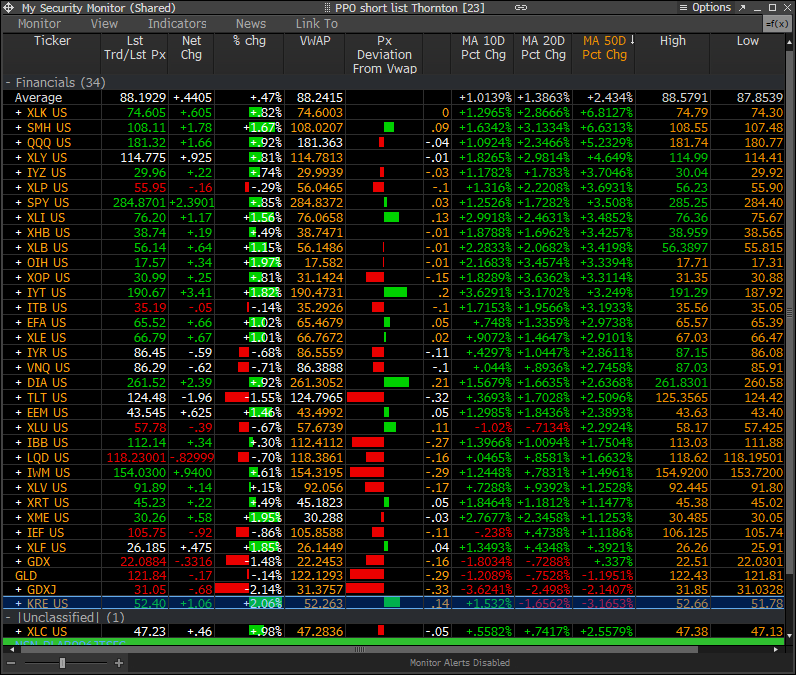
PPO Monitor - Percentage Price Oscillator
|
|
|
The PPO Monitor is a proprietary monitor developed to force rank Indexes, Sectors, and Stocks. It ranks top down by strongest to weakest by percentage above/below the 50 day moving average. Shorter term signals can be seen when the 10 and 20 day moving averages turn up (green) or down (red) which often are followed by the 50 day moving average. This is useful to watch for historically overbought/oversold percentage above/below the 50 day moving
average. It is non correlated with the DeMark Indicators however we have found upside/downside exhaustion signals often occur when something rises to the top or drifts to the bottom of the monitor - increasing the timing aspect. We share this monitor with clients with Bloomberg Terminals. An added feature is that each market/ETF can be expanded with each component force ranked in the same way. A couple other features include price deviation from intraday VWAP (useful for intraday reversals) and new 20 day highs/lows on right side. Please inquire if you would like to be permissioned to use the PPO Monitor.
Today's highlights: Strong day with top half of what's been working best with some but not that many sectors hitting 20 day highs.
|
|
|
|
|
|
|
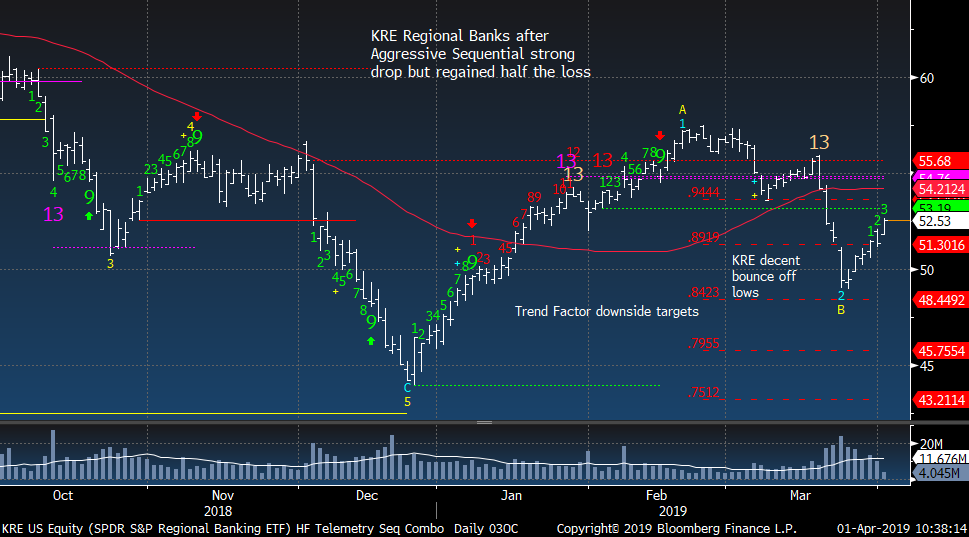
Sector Focus Part Two - Regional Banks
|
|
|
Regional Banks are bouncing and I'll take my gains as the follow through down didn't happen
|
|
|
|
|
|
|
|
|
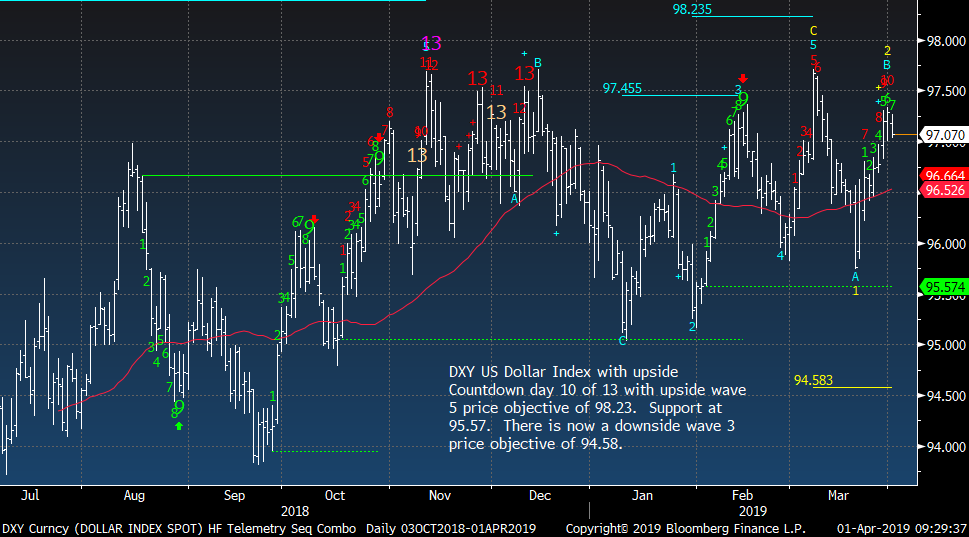
US Dollar Index moving to the high end of the range although it's down today
|
|
|
|
|
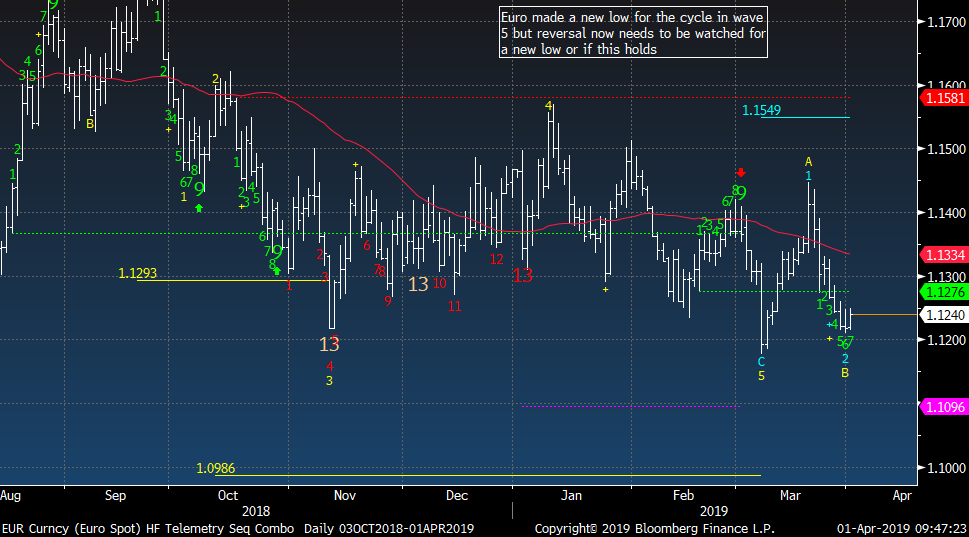
Euro spot still holding recent lows
|
|
|
|
|
|
|
European Markets - Upside Exhaustion Signals
|
|
|
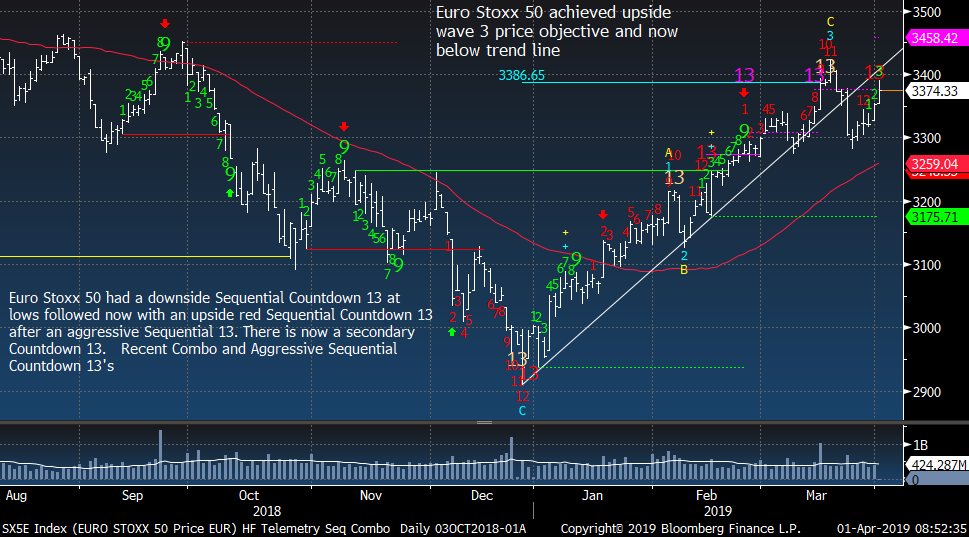
Euro Stoxx 50 with Sequential Countdown 13
|
|
|
|
|
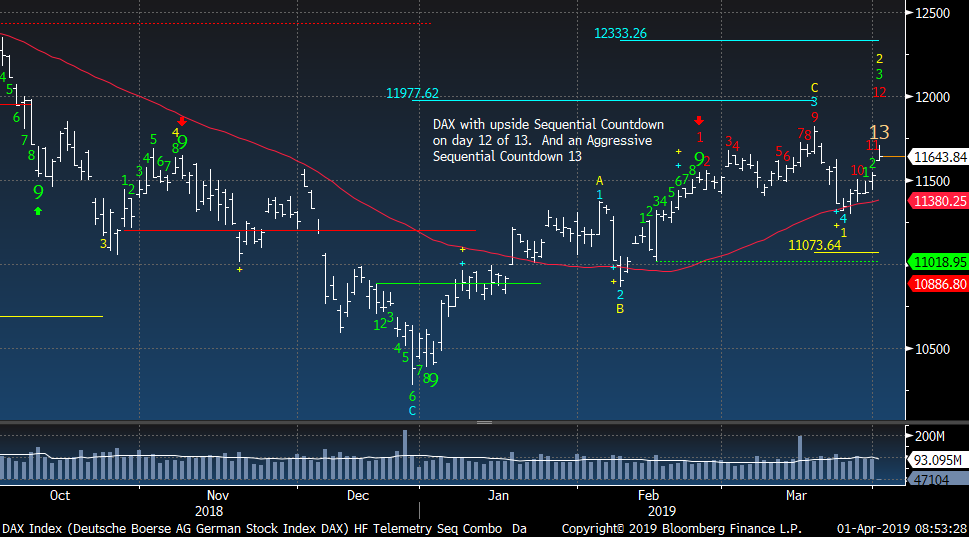
German DAX on day 12 of 13 with Sequential while there is an Aggressive Countdown
|
|
|
|
|
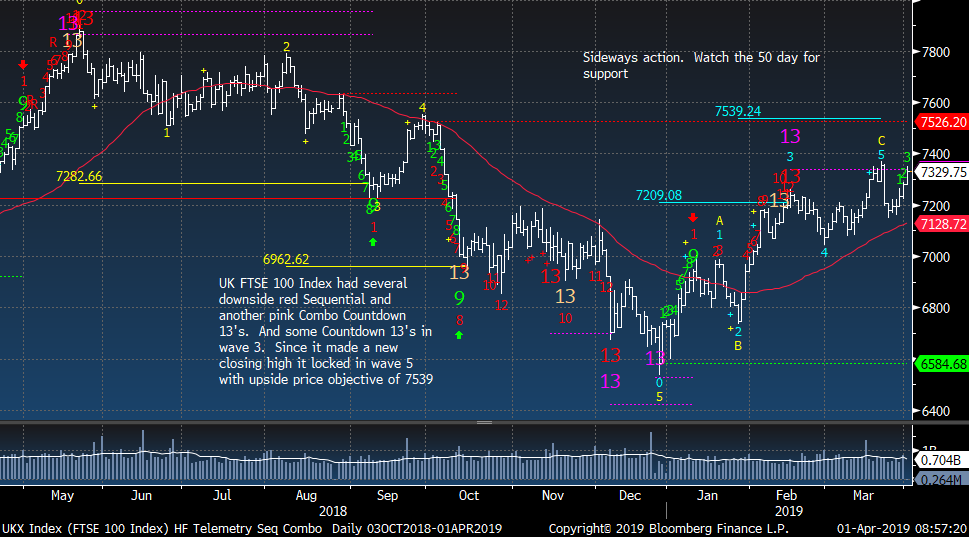
UK FTSE going sideways with potential to go for upside wave 5 price objective
|
|
|
|
|
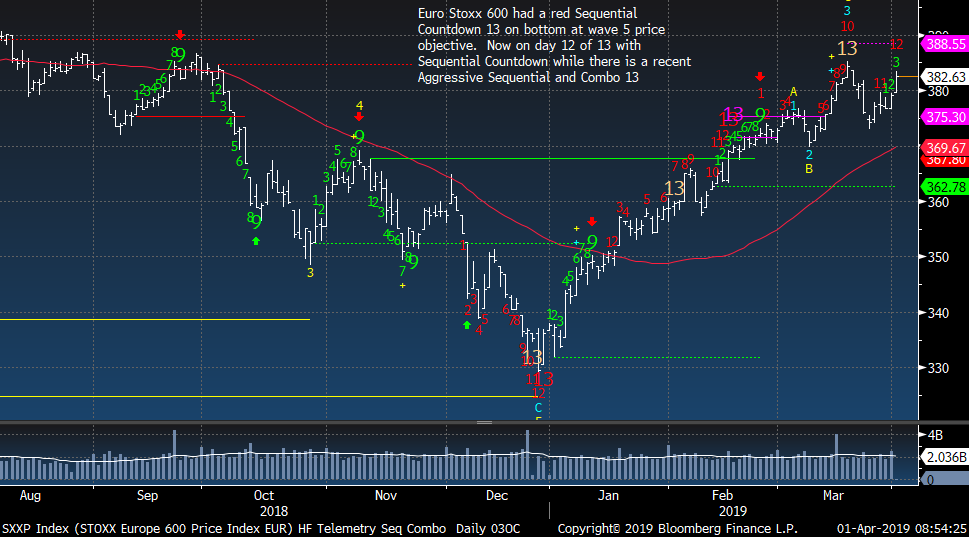
Euro Stoxx 600 on day 12 of 13 with Sequential Countdown
|
|
|
|
|
|
|
|
|
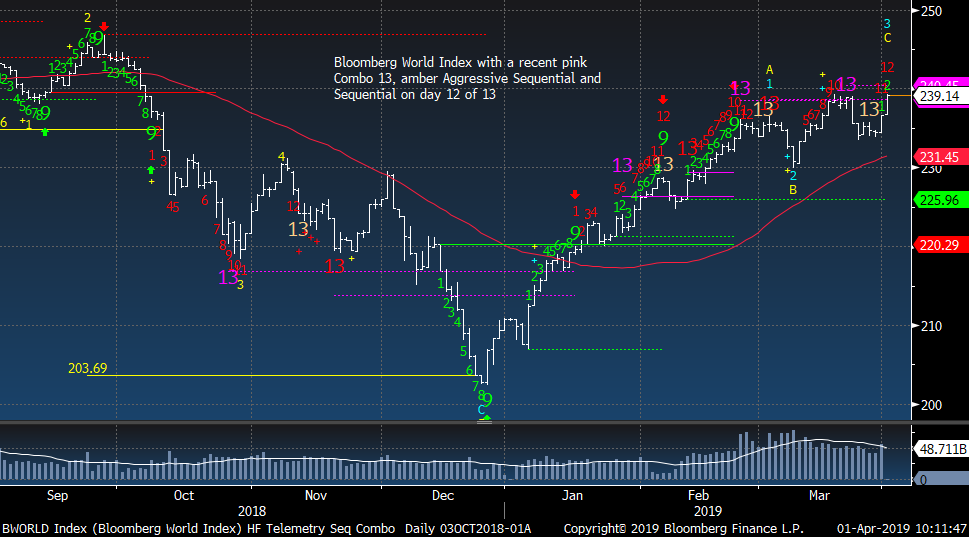
Bloomberg World Index on day 12 of 13 with Sequential Countdown
|
|
|
|
|
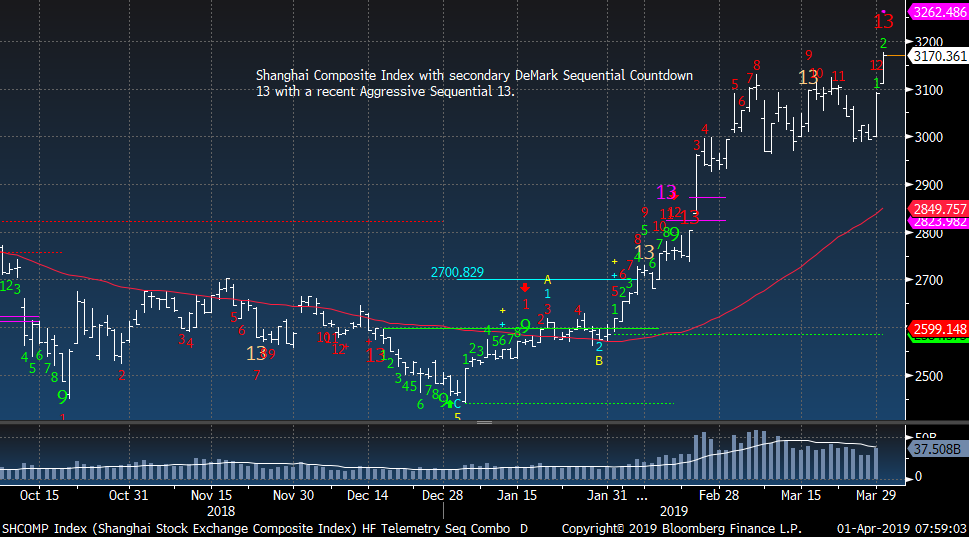
Shanghai Composite with Sequential 13
|
|
|
|
|
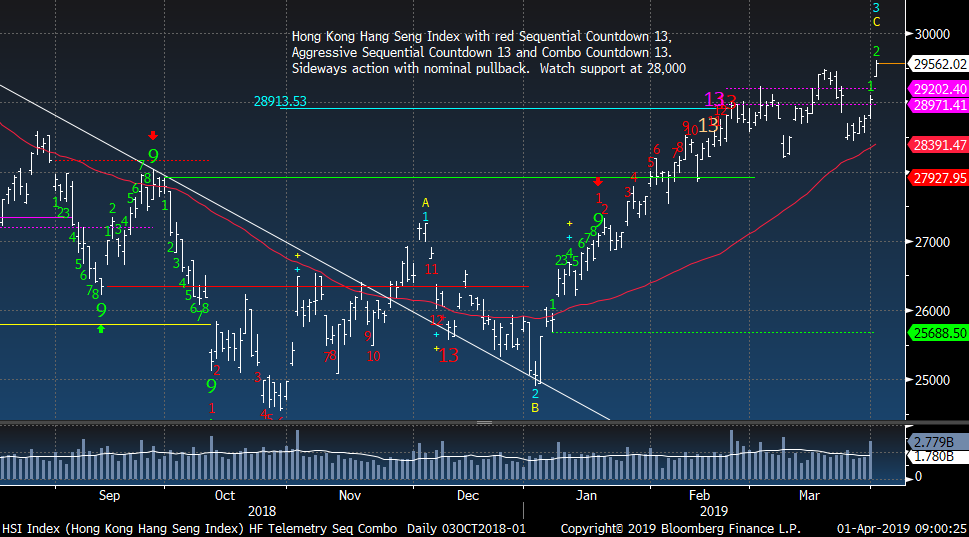
Hong Kong drifting higher on large volume. Blow off top?
|
|
|
|
|
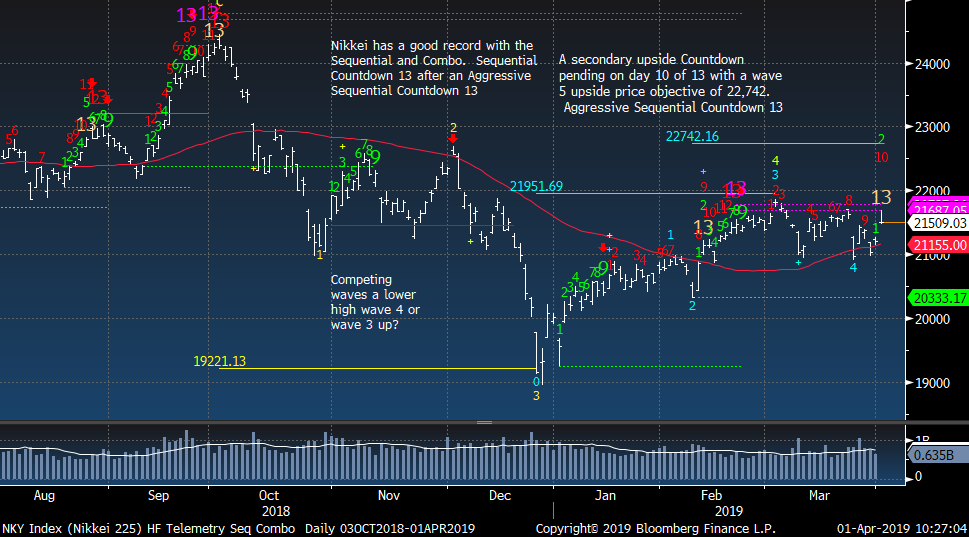
Nikkei on day 10 of 13 with Sequential while there is an Aggressive Sequential Countdown 13 today
|
|
|
|
|
|
|
|
|
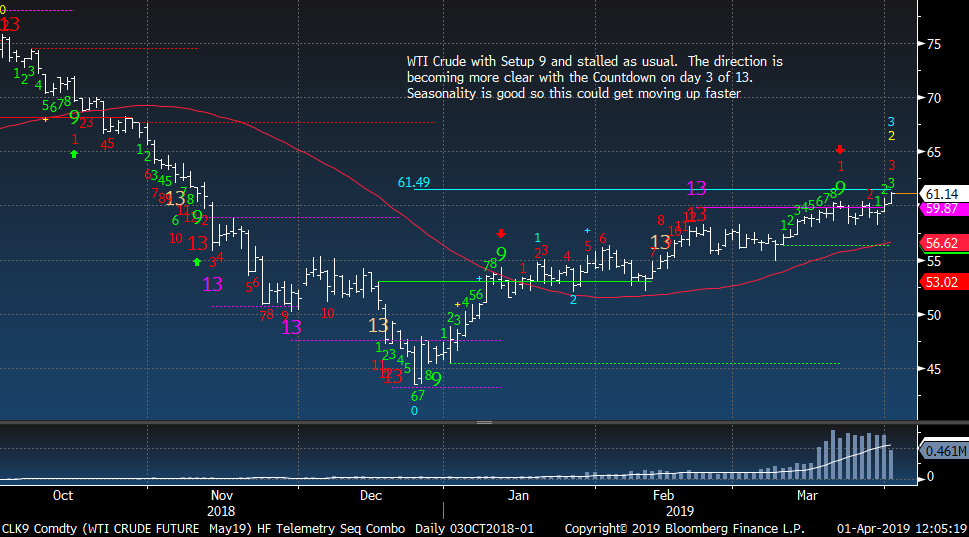
WTI Crude at wave 3 price objective but with a Countdown. This could get moving higher.
|
|
|
|
|
|
|
|
|
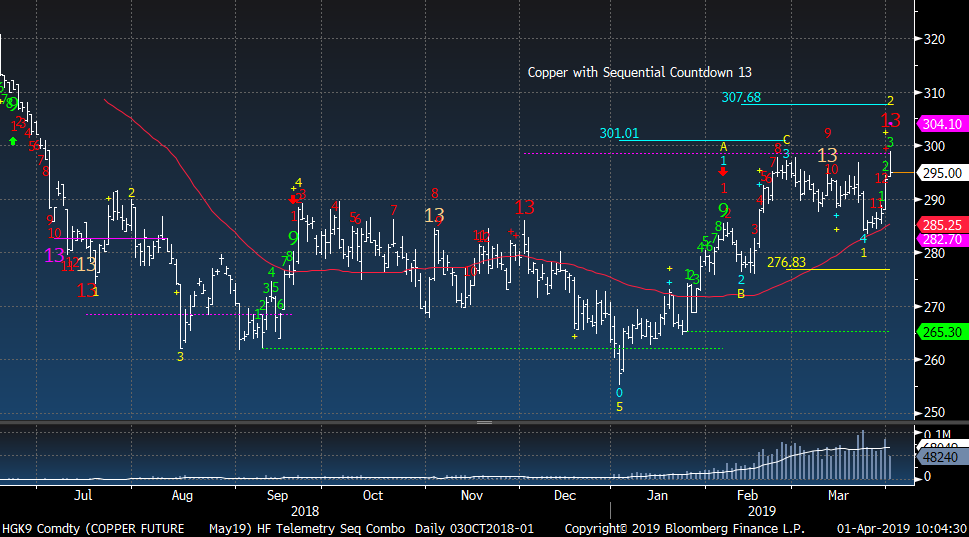
Copper with Sequential Countdown 13 today
|
|
|
|
|
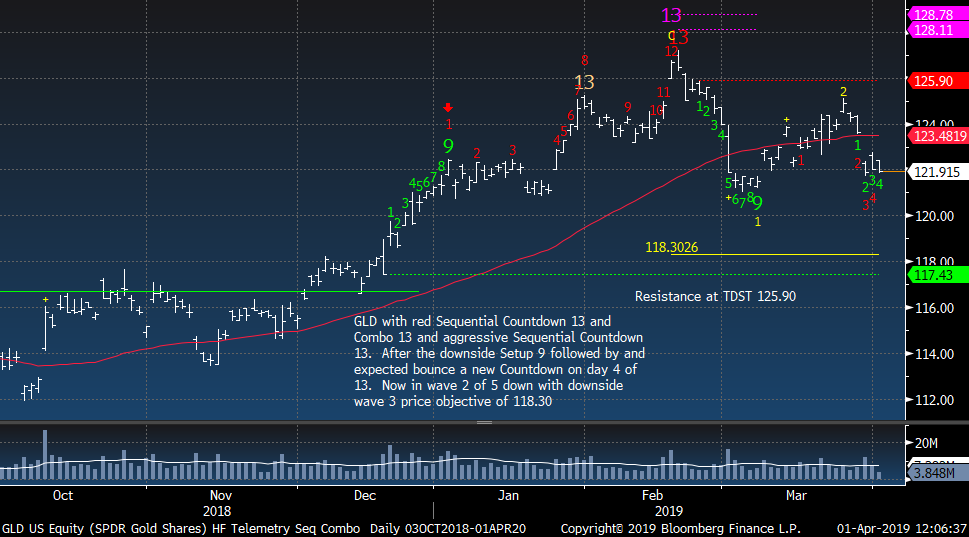
Gold continues to look lower
|
|
|
|
|
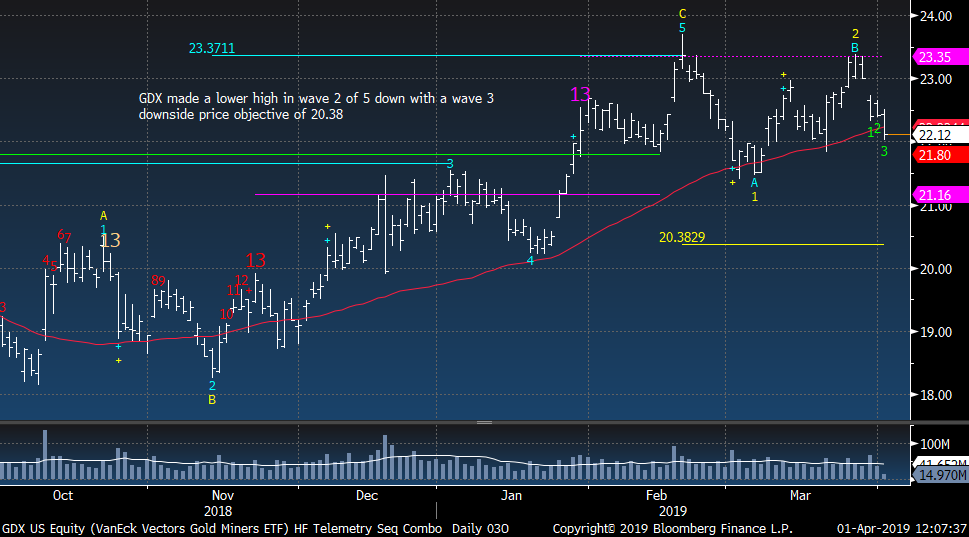
Gold Miners GDX ETF could go down 10%
|
|
|
|
|
|
|
|
|
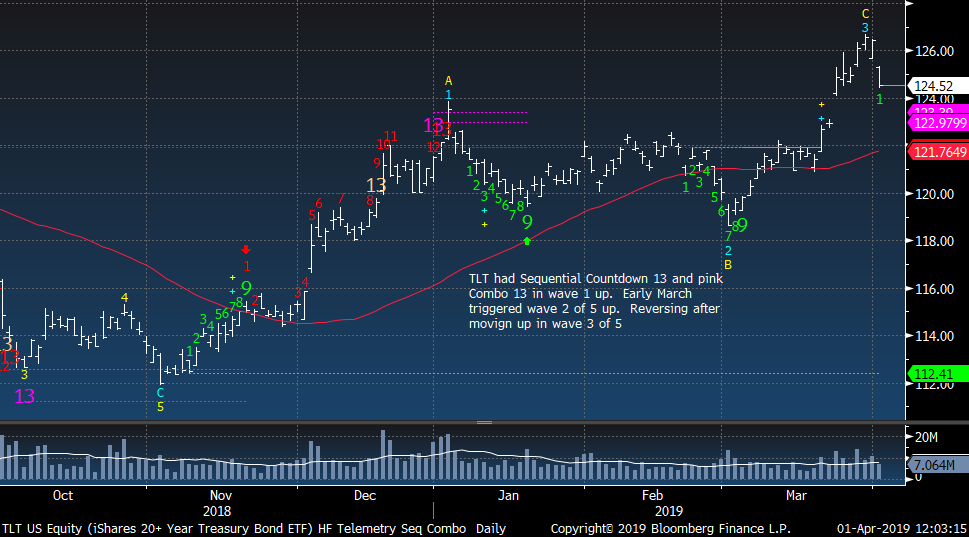
TLT reversing after getting into wave 3 of 5 on the upside. A shallow wave 4 pullback is likely then higher
|
|
|
|
|
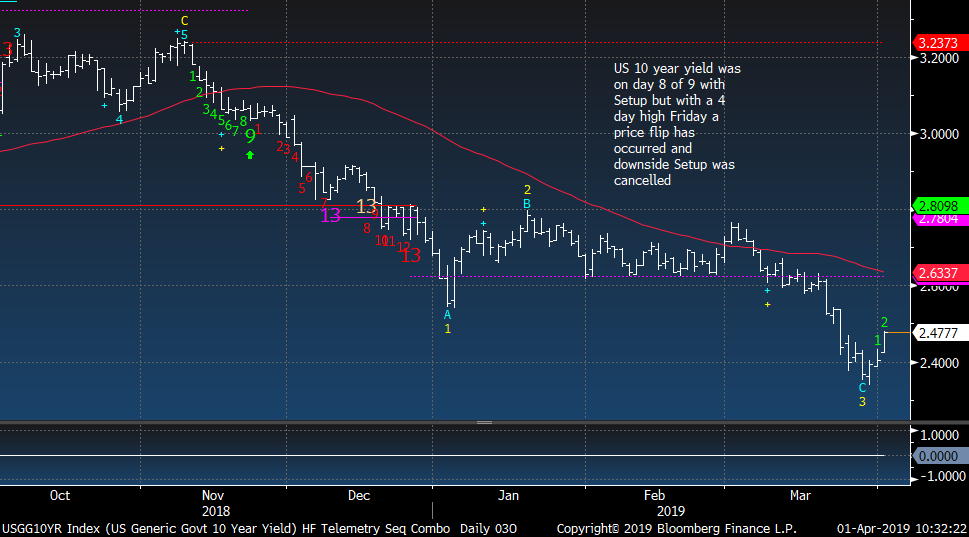
US 10 Year Yield made a wave 3 low so a lower high (below yellow 2) wave 4 bounce is possible then wave 5 lower lows
|
|
|
|
|
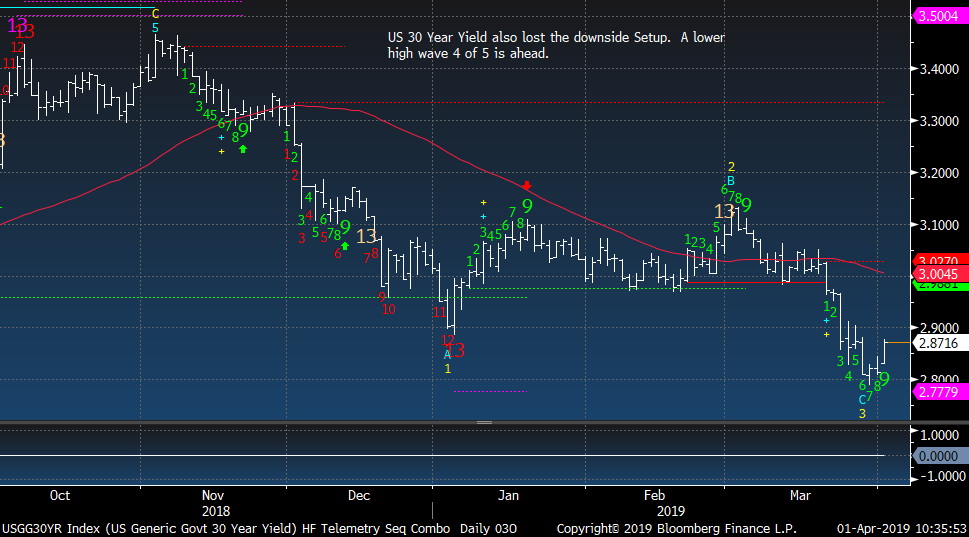
US 30 Year Yield has a wrong annotation as it did get the Setup 9. Same wave pattern
|
|
|
|
|
|
|
|
|
|
|
Unsubscribe me from Hedge Fund Telemetry
Hedge Fund Telemetry LLC, P.O. Box 4675, Greenwich, CT 06861, United States
CONFIDENTIALITY NOTE and DISCLAIMER: This message is for the named person's use only. It may contain confidential, proprietary or legally privileged material. No confidentiality or privilege is waived by any accidental or unintentional transmission. If you receive this message in error, please immediately delete it and all copies of it from your system, destroy any hard copies and notify the sender. You must not, directly or indirectly, use, disclose,
distribute, print or copy any part of this message if you are not the intended recipient. Hedge Fund Telemetry LLC. cannot guarantee the confidentiality of the material transmitted; therefore, information of a sensitive or confidential nature should not be transmitted. There is risk in trading markets. Hedge Fund Telemetry LLC reports are based on information gathered from various sources and believed to be reliable, but are not guaranteed as to accuracy and completeness. The information is subject to change without notice and Hedge Fund Telemetry LLC has no obligation to provide any updates or changes. Hedge Fund Telemetry LLC is providing this data for informational and educational purposes and does not believe that it is sufficient to base an investment decision on. This information should not be regarded as a solicitation or recommendation of any particular security or to engage in any trading strategy. One should always check with your licensed financial
advisor to determine suitability of any investments.
|
|
|
|
|